Satellite radar images reveal ground movement of infamous sinkholes near Wink, Texas; suggest the two existing holes are expanding, and new ones are forming as nearby subsidence occurs at an alarming rate.
Residents of Wink and neighboring Kermit have grown accustomed to the two giant sinkholes that sit between their small West Texas towns.
But now radar images taken of the sinkholes by an orbiting space satellite reveal big changes may be on the horizon.
A new study by geophysicists at Southern Methodist University, Dallas, finds the massive sinkholes are unstable, with the ground around them subsiding, suggesting the holes could pose a bigger hazard sometime in the future.
The two sinkholes — about a mile apart — appear to be expanding. Additionally, areas around the existing sinkholes are unstable, with large areas of subsidence detected via satellite radar remote sensing.
That leaves the possibility that new sinkholes, or one giant sinkhole, may form, said geophysicists and study co-authors Zhong Lu, professor, Shuler-Foscue Chair, and Jin-Woo Kim research scientist, in the Roy M. Huffington Department of Earth Sciences at SMU.
“This area is heavily populated with oil and gas production equipment and installations, hazardous liquid pipelines, as well as two communities. The intrusion of freshwater to underground can dissolve the interbedded salt layers and accelerate the sinkhole collapse,” said Kim, who leads the SMU geophysical team reporting the findings. “A collapse could be catastrophic. Following our study, we are collecting more high-resolution satellite data over the sinkholes and neighboring regions to monitor further development and collapse.”
Lu and Kim reported the findings in the scientific journal Remote Sensing, in the article “Ongoing deformation of sinkholes in Wink, Texas, observed by time-series Sentinel-1A SAR Interferometry.”
The research was supported by the U.S. Geological Survey Land Remote Sensing Program, the NASA Earth Surface & Interior Program, and the Shuler-Foscue Endowment at Southern Methodist University.
Unstable ground linked to rising, falling groundwater
The sinkholes were originally caused by the area’s prolific oil and gas extraction, which peaked from 1926 to 1964. Wink Sink No. 1, near the Hendricks oil well 10-A, opened in 1980. Wink Sink No. 2, near Gulf WS-8 supply well, opened 22 years later in 2002.
It appears the area’s unstable ground now is linked to changing groundwater levels and dissolving minerals, say the scientists. A deep-seated salt bed underlies the area, part of the massive oil-rich Permian Basin of West Texas and southeastern New Mexico.
With the new data, the SMU geophysicists found a high correlation between groundwater level in the underlying aquifer and further sinking of the surface area during the summer months, influenced by successive roof failures in underlying cavities.
Satellite images and groundwater records indicate that when groundwater levels rise, the ground lifts. But the presence of that same groundwater then speeds the dissolving of the underground salt, which then causes the ground surface to subside.
Everything’s bigger in Texas, and the Wink sinkholes are no exception
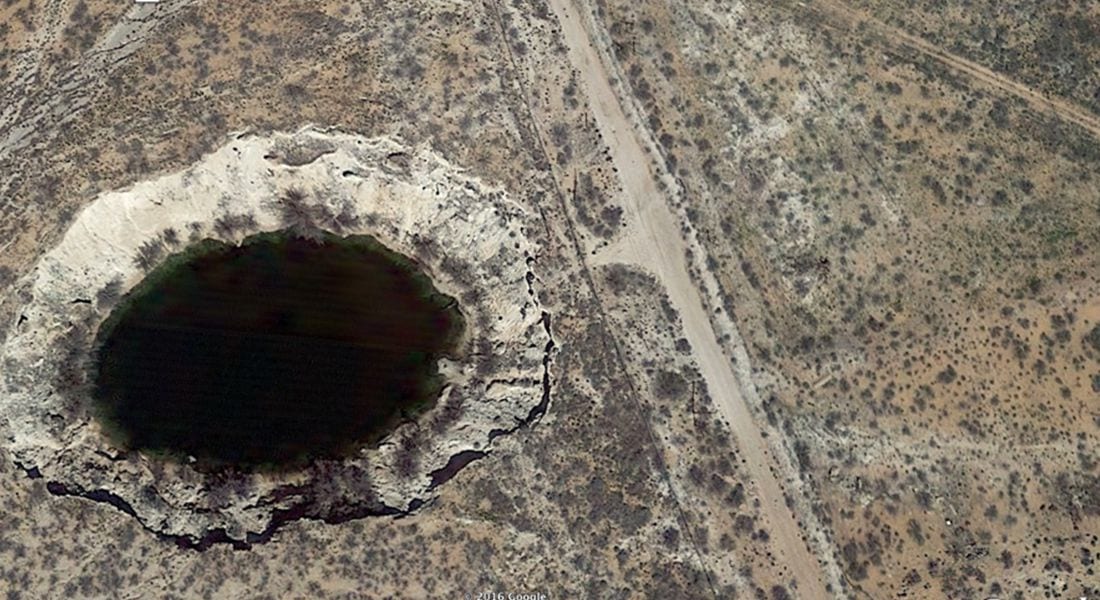
Officials have fenced off the two sinkholes near Wink, a town of about 940 people, and Kermit, a town of about 6,000 people. The giant holes are notable features on the area’s vast plains, which are dotted mostly with oil pump jacks, storage facilities, occasional brush and mesquite trees.
Based on modeling of satellite image datasets, SMU’s researchers report that Wink Sink No. 1, which is closer to the town of Kermit, appears to be the most unstable. The smaller hole of the two, it has grown to 361 feet (110 meters) across — the length of a football field.
“Even though Wink No. 1 collapsed in 1980, its neighboring areas are still subsiding,” say the authors, “and the sinkhole continues to expand.” An oval-shaped deformation circling the sinkhole measures three-tenths of a mile (500 meters) wide and is subsiding up to 1.6 inches (4 centimeters) a year.
Wink Sink No. 2, which is nine-tenths of a mile south of No. 1 and which sits closer to the town of Wink, is the larger of the sinkholes. It varies from 670 feet to 900 feet across.
Wink No. 2 is not experiencing as much subsidence as Wink No. 1. However, its eastern side is collapsing and eroding westward at a rate of up to 1.2 inches (3 centimeters) a year.
“Wink No. 2 exhibits depression associated with the ongoing expansion of the underground cavity,” the authors report.
Some ground that doesn’t even border the edges of the two sinkholes is also subsiding, the scientists observed. An area more than half a mile (1 kilometer) northeast of No. 2 sank at a rate of 1.6 inches (4 centimeters) in just four months.
Ground northeast of sinkholes is subsiding, suggesting new ones forming
The largest rate of ground subsidence is not at either sinkhole, but at an area about seven-tenths of a mile (1.2 kilometers) northeast of No. 2. Ground there is subsiding at a rate of more than 5 inches (13 centimeters) a year.
It’s aerial extent, the researchers report, has also enlarged over the past eight years when a previous survey was done.
“The enlarged deformation could be an alarming precursor to the potential future development of hazards in the vicinity,” said the authors.
Additionally, ground along a road traveled by oil field vehicles, about a quarter mile (400 meters) directly north of No. 2, is subsiding about 1.2 inches (3 centimeters) a year.
Ground’s movement detected with radar technique
The satellite radar datasets were collected over five months between April 2015 and August 2015. With them, the geophysicists observed both two-dimension east-west deformation of the sinkholes, as well as vertical deformation.
The SMU scientists used a technique called interferometric synthetic aperture radar, or InSAR for short, to detect changes that aren’t visible to the naked eye.
“From 435 miles above the Earth’s surface, this InSAR technique allows us to measure inch-level subsidence on the ground. This is a monumental human achievement, and scientists will not stop endeavoring to improve this technique for more precise measurements,” said Lu, who is world-renowned for leading scientists in InSAR applications. Lu is a member of the Science Definition Team for the dedicated U.S. and Indian NASA-ISRO InSAR mission, set for launch in 2020 to study hazards and global environmental change.
InSAR accesses a series of images captured by a read-out radar instrument mounted on the orbiting satellite Sentinel-1A. Sentinel-1A was launched in April 2014 as part of the European Union’s Copernicus program.
Simply put, Sentinel-1A bounces a radar signal off the earth, then records the signal as it bounces back, delivering measurements. The measurements allow geophysicists to determine the distance from the satellite to the ground, revealing how features on the Earth’s surface change over time.
“Sinkhole formation has previously been unpredictable, but satellite remote sensing provides a great means to detect the expansion of the current sinkholes and possible development of new sinkholes,” said Kim. “Monitoring the sinkholes and modeling the rate of change can help predict potential sinkhole development.”
Sentinel-1A data were obtained from Sentinels Scientific Data Hub – Copernicus. Groundwater well data came from the Texas Water Development Board. — Margaret Allen, SMU


 Real-time audio of corporal punishment shows kids misbehave within 10 minutes of spanking
 Conventional vs. modern: Repertoire drives opera house identity, market share
 Women have made strides for equality in society, but gender gap still exists in art museum directorships
 Search for dark matter covers new ground with CDMS experiment in Minnesota
 NOvA experiment glimpses neutrinos, one of nature’s most abundant, and elusive particles
 SMU scientists to deploy seismic monitors in North Texas region near Azle, Texas
 Parents less likely to spank after reading briefly about its links to problems in children
 Wall Street’s short sellers wrongly maligned — detected red flags ahead of US financial crisis