In fiscal year 2013, total spending on operations and maintenance at SMU was 20% more than the industry average in higher education. On March 2, the Facilities Initiative team held their inaugural meeting and began working to help the University save between $6 and $10 million in annual facilities and energy spending and improve service delivery across campus.
The primary work of this team will be to identify how to deliver best-in-class facilities efficiency across the entire University while seamlessly supporting SMU’s academic mission.
Sub-Teams +
Leadership +
Dr. Sam Holland, dean of the Meadows School of the Arts, and Dr. Tom Barry, vice president for executive affairs and professor of marketing, will serve as executive sponsors of the Facilities Initiative. Philip Jabour, associate vice president and University architect for Facilities Planning and Management, will serve as project manager for the team.
The team members are as follows:
Energy Usage
- Team Lead: Scot Montague (Dedman College)
- Steve Yeager (Dedman Law)
- Duane Harbin (Perkins)
- Jay Meister (Business & Finance)
- Aaron Conniff (Provost)
Space Utilization
- Team Lead: Jay Hengst (Meadows)
- Darah Rippy (Provost)
- Scott Boone (Business & Finance)
- Marilyn Swanson (Simmons)
- Bill Bridge (Dedman Law)
Service Delivery
- Team Lead: Bill Dworaczyk (CUL)
- Allison Day (Student Affairs)
- Denton Bricker (Business & Finance)
- Kris Harris (Athletics)
- Aaron Molkentine (Business & Finance)
Facilities News +
- SMU to Adopt New Management Plan for Facilities Services Operations
- SMU Facilities Services Agreement Signed Between SMU and Aramark
- Watch the Recap of the Facilities Info Session
- Facilities Initiative’s Recommendation on Temperature Set Point Change Approved
- Facilities Initiative to Address Energy Usage, Space Utilization and Service Delivery
- The Shared Services Survey Results
Facilities FAQ +
- Why do I sometimes see lights on during the day?
- Explaining the Role of Building Liaisons
- Frequently Asked Questions About the Facilities Initiative
Metrics +
Created to improve operations at SMU and identify savings in administrative costs to reallocate to academic purposes, the Office of Operational Excellence has identified key measurements to track progress towards its mission. At the beginning of the Operational Excellence for the Second Century (OE2C) project, research revealed that our peers across aspirational universities are spending a greater percentage of funds on the academic mission versus administration costs.
To measure SMU’s progress toward achieving a competitive balance of academic and administrative spending through bold initiatives that serve the staff, faculty, and students, the Office of Operational Excellence has identified a set of key metrics.
Below, you’ll find key metrics from Facilities including the following Q&A with team leaders.
Why were these particular performance metrics chosen to represent progress toward operational excellence in your area?
Facilities Planning and Management selected performance metrics that demonstrate the holistic approach the department has taken in contributing to the success of the University mission. The metrics address cost reduction, energy savings, improving communication and delivering more efficient solutions to work requests and space allocation. When achieved, all of the metrics provide a benefit to the SMU community and improve the performance of our department.
How do these metrics support the work of your OE2C initiative?
The metrics illustrate the long-term plan for energy cost savings, reduction for the SMU community in time and resources being committed to reporting and maintaining University facilities, and improvement in the resolution of facility work requests. Each of these categories were an impact of the Facilities OE2C initiative.
Looking at your performance measures, what findings are most interesting or compelling to you?
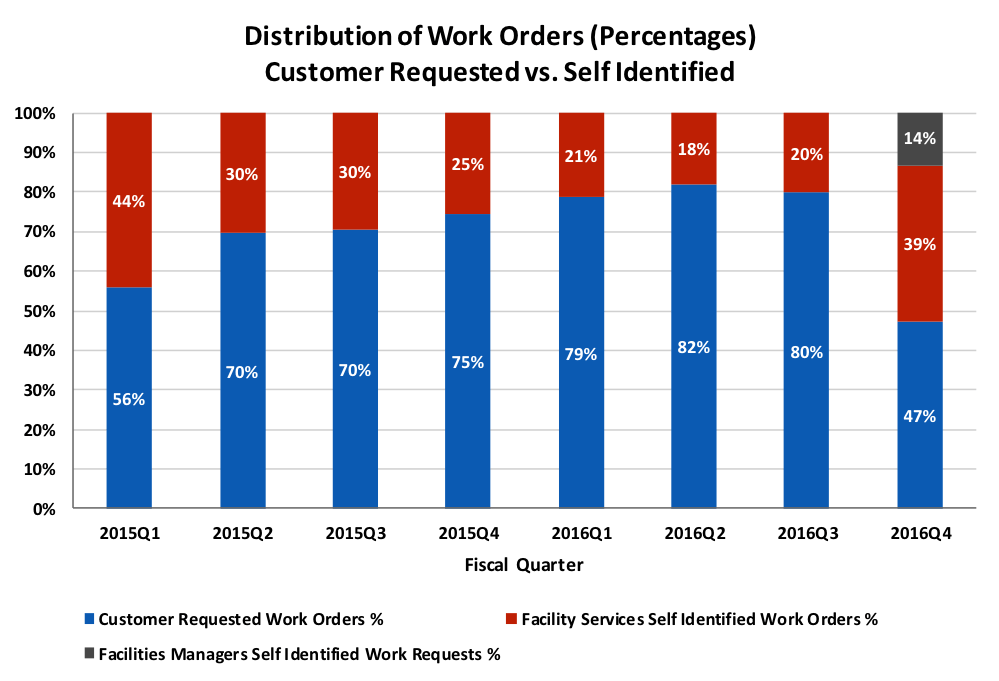
The decrease in days to complete a work request, decrease in number of work requests submitted by faculty and staff, and the increase in Customer Satisfaction Scores are a perfect illustration. Looking at Q4 of 2016, the three metrics together shows a direct correlation between the decrease in time the greater community is spending submitting work requests, the faster those work requests are being resolved and higher satisfaction scores. Following these performance measures allows us to identify what is successful and track the outcome.
What are your main areas of focus going forward?
Facilities Planning and Management will focus on maintaining the energy initiatives set in place for the University, improving work request reporting and resolution, and continuing to improve Facilities Management support for the SMU community.
The Facilities Institutional Metrics Dashboard
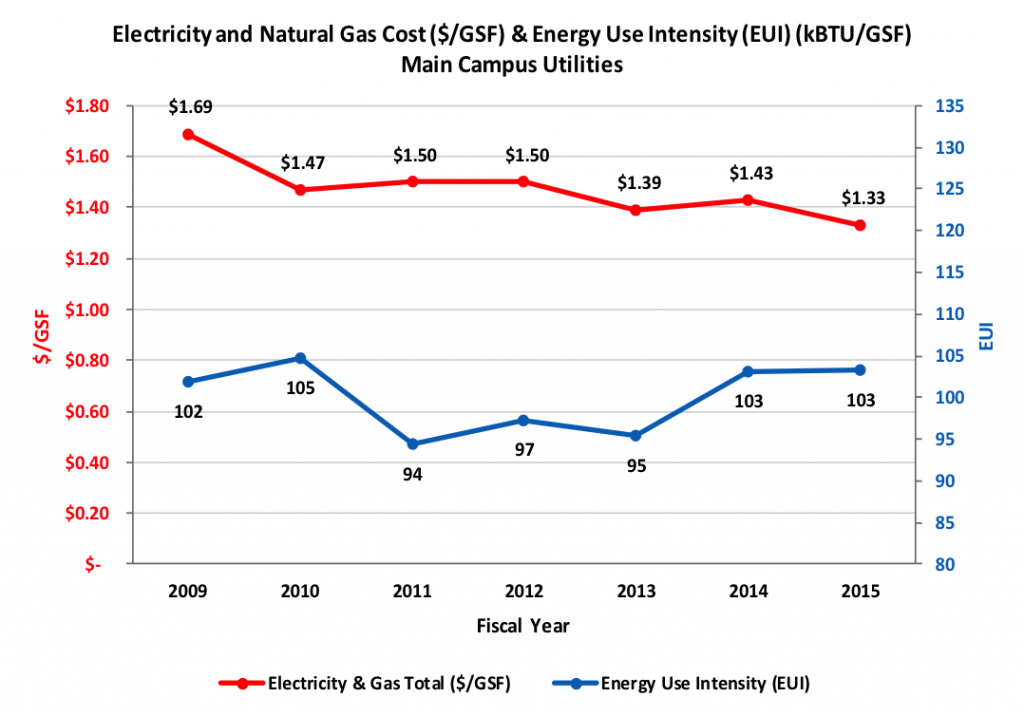
- The data presented excludes: RLSH Apartments, Greek Houses, East Campus, Plano Campus & Taos Campus. These buildings are excluded because the square feet for this slide relate only to electricity and natural gas fed from the Central Plant and the multi-stack system in the Mustang Parking Center.
- Energy Use Intensity (EUI) is the measure of how much electricity and natural gas is used per gross square foot per year.
- EPA’s Energy Star indicates that the national median site EUI for a four-year university is 131 kBTU/GSF/Yr.
- Weather will influence energy usage, from unusually hot summers to severe cold winters, and will impact how much energy is used per square foot from year to year.
- Goal: To maintain low energy cost and an EUI that is below the national median for a four-year university.
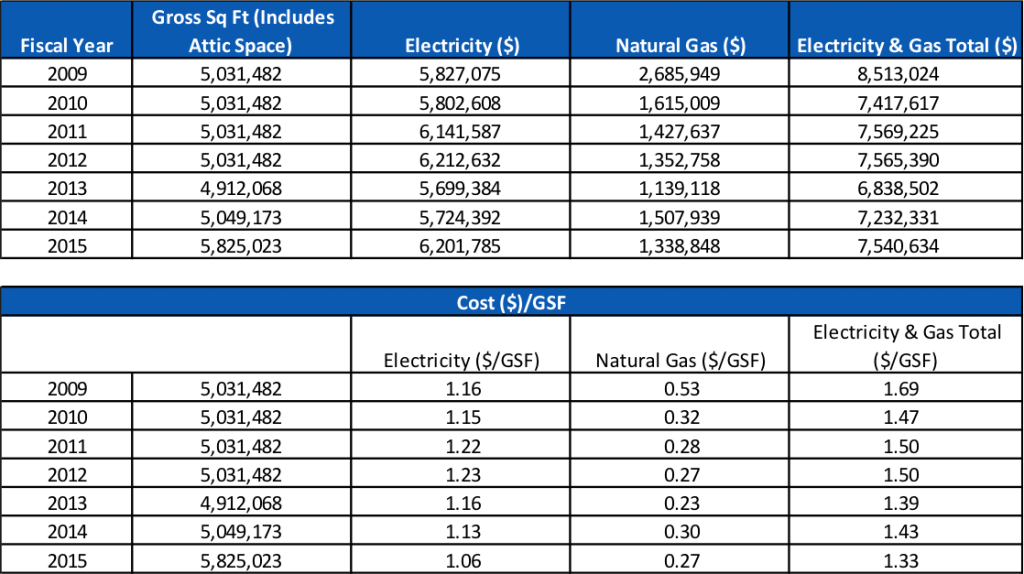
Historical Energy Cost/GSF – Main Campus on Central Plant/Multistack System
- The data presented excludes: RLSH Apartments, Greek Houses, East Campus, Plano Campus & Taos Campus. These buildings are excluded because the square feet for this slide relate only to electricity and natural gas fed from the Central Plant and the multi-stack system in the Mustang Parking Center.
- Weather will influence energy usage, from unusually hot summers to severe cold winters and will impact how much energy is used per square foot from year to year.
- The increase in GSF from 2014 to 2015 is attributable to the new residential commons, Arnold dining, and the 800-space parking center being added.
- Goal: To maintain low energy cost
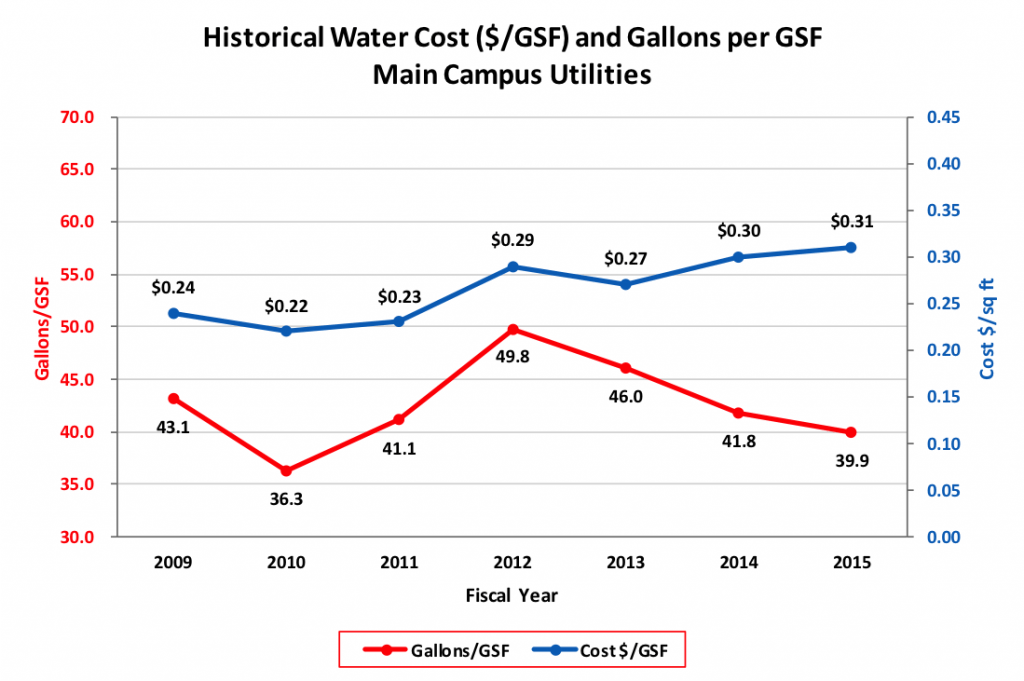
- The data presented excludes: RLSH Apartments, Greek Houses, Tennis Courts, University Data Center, East Campus, Plano Campus & Taos Campus. These are excluded because the square feet for this slide specifically relate to water fed from the three water meters for the main campus.
- The high water usage during fiscal years 2012 and 2013 is attributable to a combination of unusually high temperatures and low levels of annual precipitation.
- Goal: To maintain water usage below 50 gallons per gross square foot per year.
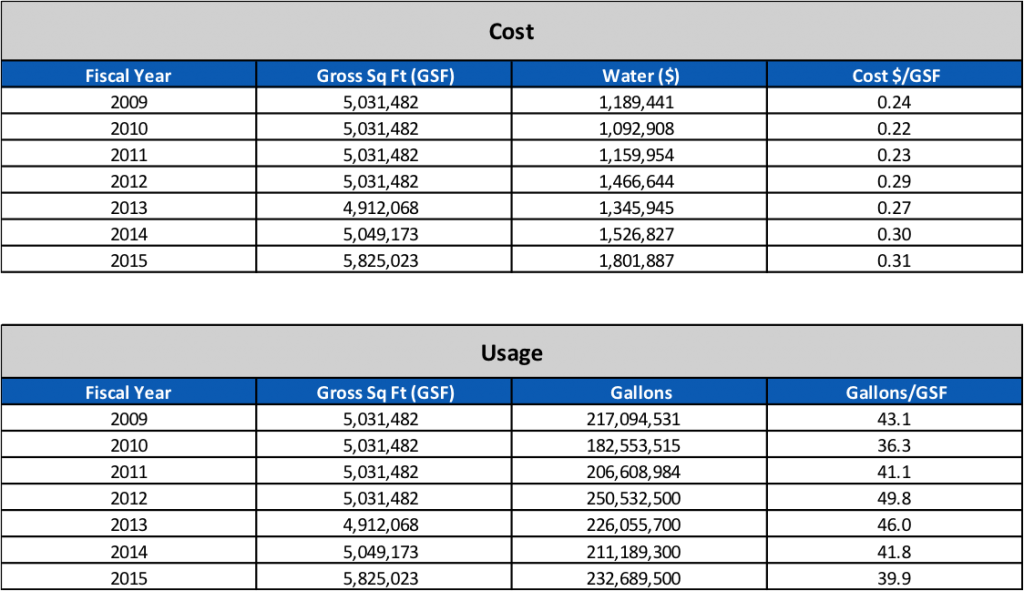
Historical Water Cost and Usage – Main Campus
- The data presented excludes: RLSH Apartments, Greek Houses, Tennis Courts, University Data Center, East Campus, Plano Campus & Taos Campus. These are excluded because the square feet for this slide specifically relate to water fed from the three water meters for the main campus.
- The increase in GSF from 2014 to 2015 is attributable to the new residential commons, Arnold dining, and the 800-space parking center being added.
- The high water usage during fiscal years 2012 and 2013 is attributable to a combination of unusually high temperatures and low levels of annual precipitation.
- Goal: To maintain water usage below 50 gallons per gross square foot per year.
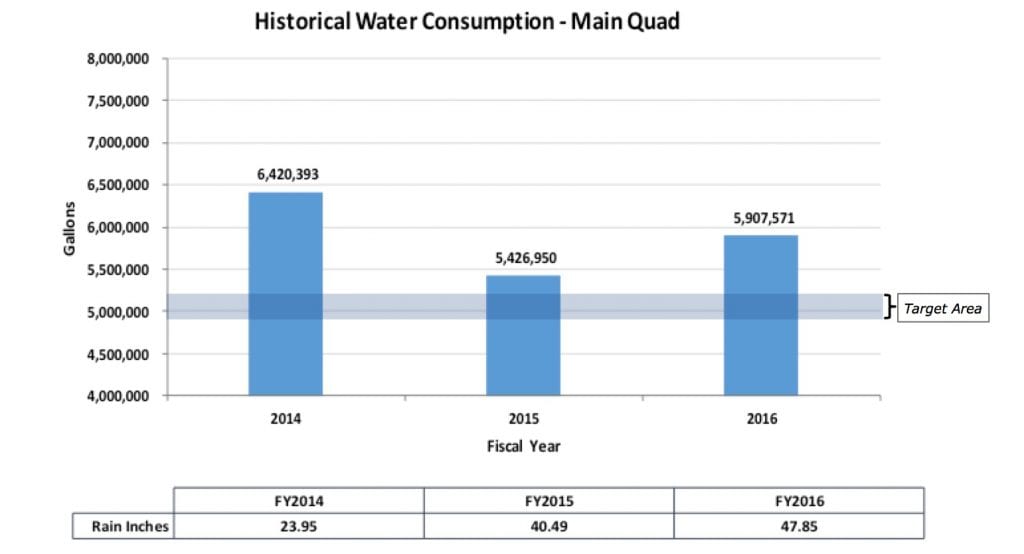
- Precipitation data is collected from the onsite irrigation management system, Maxicom System, located at Ford Stadium. In the near future, we will transition from collecting precipitation data onsite to obtaining the data from the National Oceanic and Atmospheric Administration (NOAA) weather station at Love Field Airport.
- Weather conditions will affect the main quad’s water usage, in that, during seasons of drought, more water will be required. Conversely, during seasons of above average precipitation, less water will be required to irrigate the main quad. Therefore, the goal to reduce usage is set at a range in order to accommodate the effects of weather. In addition, SMU requires that the main quad remain green year round, which is also a contributing factor to water usage.
- Conversion from rotary type irrigation sprinkler heads to sprayer irrigation sprinkler heads for reduction of water consumption in the Main Quad to be completed in August 2016.
- Goal: To reduce main quad irrigation to a range between 4.9 – 5.2 million gallons/fiscal year based upon FY2014 usage of 6.4 million gallons of water.
- Includes all in-scope and out-of-scope work orders.
- Excluded: Preventive Maintenance Work orders and SMU in Taos.
- Facilities Managers started submitting self identified work requests in the computerized maintenance management system on March 1, 2016.
- Goal: To continually see a decline in customer requested work orders to attain a level not to exceed 50%.
- Includes all in-scope and out-of-scope work orders.
- Excluded: Preventive Maintenance Work orders and SMU in Taos.
- Staff/Faculty counts used for calculating this metric are obtained from SMU’s Institutional Research website.
- Goal: To minimize and keep average customer submitted work orders under 1 per SMU FTE (Faculty & Staff) per fiscal quarter.
- Includes all in-scope and out-of-scope work orders.
- Excluded: Preventive Maintenance Work orders and SMU in Taos.
- Facilities Managers started submitting self identified work requests in the computerized maintenance management system on March 1, 2016.
- Goal: To continually see a decline in customer requested work orders to attain a level not to exceed 50%.
 Includes all in-scope and out-of-scope work orders.
- *New CMMS System rolled out (TMA) in 2015Q1.
- **Procedural change in the beginning of 2015Q3 to close open work orders.
- ***Procedural change in the beginning of 2016Q2 to allow technicians to close work orders in real time.
- Goal: To complete corrective work orders within an average of 10 calendar days.
- Includes all in-scope and out-of-scope work orders.
- Effective May 1, 2016, surveys issued on all non-self-identified work orders. From June 1, 2015 – April 30, 2016 surveys issued on every 3rd non-self-identified work order.
- Goal: To maintain a customer average score between Excellent (1) and Good (2).
- Gross square footage (GSF) includes attic space. Does not include the following: Plano, Taos, grounds assets, single family houses, apartments, President’s house, Sigma Chi, commercial and retail properties, 80% of Johnson Square, surface parking lots, Athletic Courts, Athletic Fields, Recreational Courts and Recreational Field.
- Information for faculty/staff FTE and student FTE cited from SMU’s Office of Institutional Research website. Information for GSF provided by SMU’s Office of Facilities Planning and Management.
- Target areas for the two categories are based on benchmarking against peer institutions. Calculations were made using information found on Vanderbilt’s and TCU’s websites, as follows: (1) Vanderbilt (Aspirant) – 6,900,000 SF, 4,075 faculty/staff and 12,605 students for the fall of 2015. This equates to 547 SF per student FTE and 1,693 SF per faculty/staff FTE, and (2) TCU (Cohort) – 4,476,119 SF, 2,206 faculty/staff and 10,143 students for the fall of 2015. This equates to 441 SF per student FTE and 2,029 SF per faculty/staff FTE.
- Goal: To maintain a square footage ratio per student FTE and per faculty/staff FTE within the total square footage ratios of SMU’s cohort and aspirational institutions, TCU and Vanderbilt, respectively.
See more metrics in the coming weeks on our website or by subscribing to Operational Excellence’s email digest.

