Metrics posted February 2018.
Travel
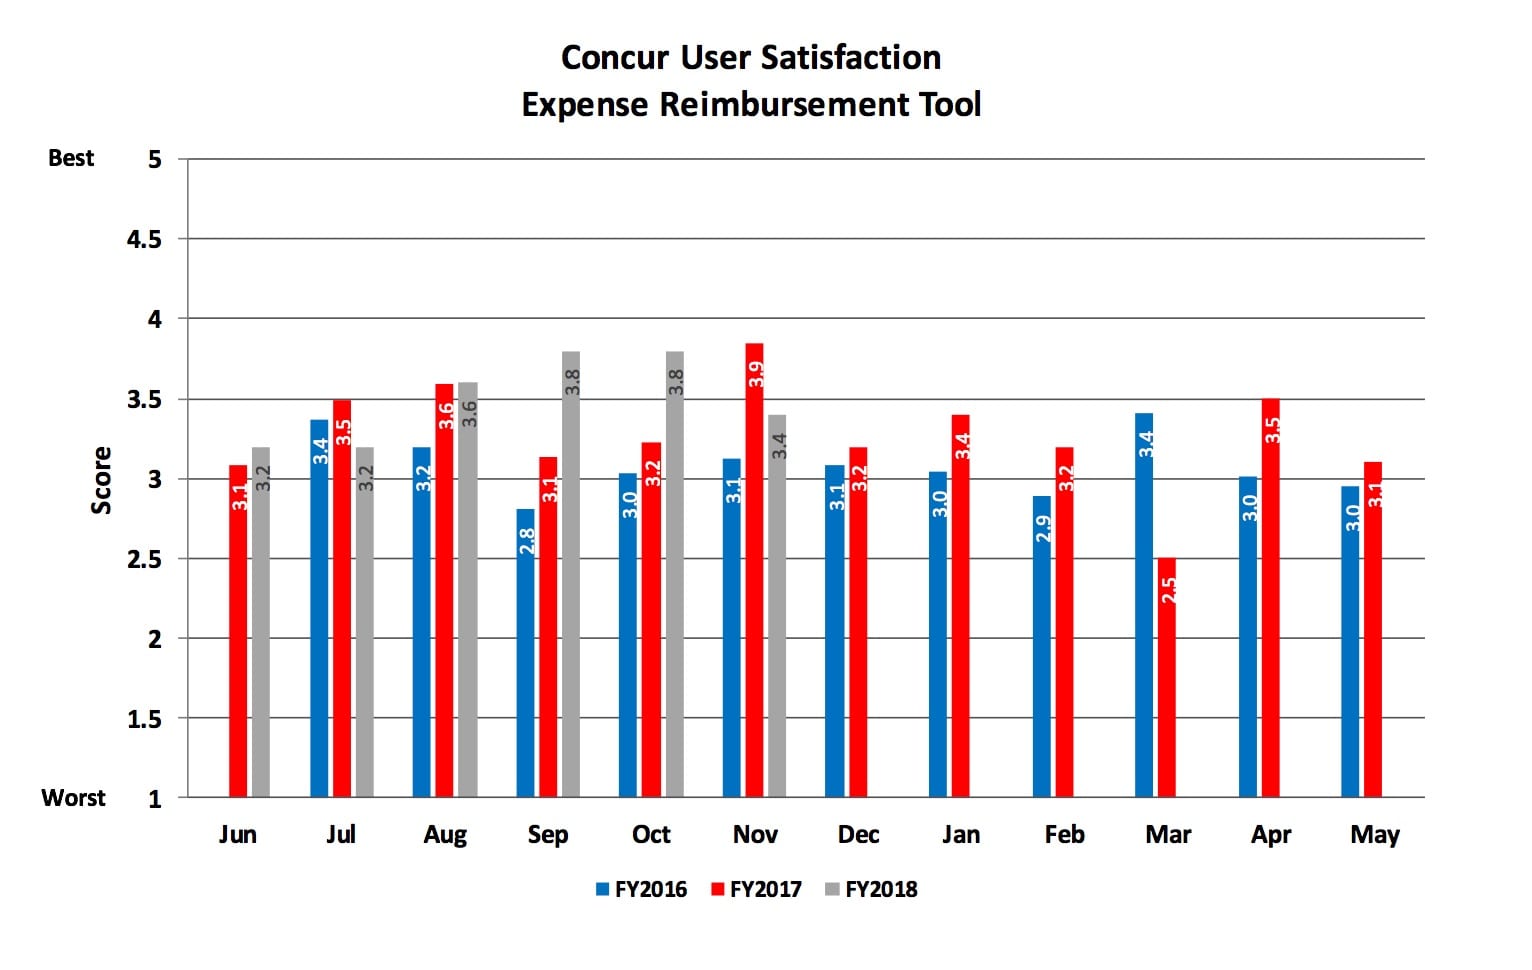
Goal: To achieve a score of 4 or above.

- SMU Purchasing has asked Anthony Travel to provide a proposal from a cooperative contract (E&I) to see if savings can be realized. Conversations with Anthony Travel are ongoing and the Purchasing department will be providing updates as progress is made.
- SMU Purchasing has asked Anthony Travel to provide a proposal from a cooperative contract (E&I) to see if savings can be realized. Conversations with Anthony Travel are ongoing and the Purchasing department will be providing updates as progress is made.
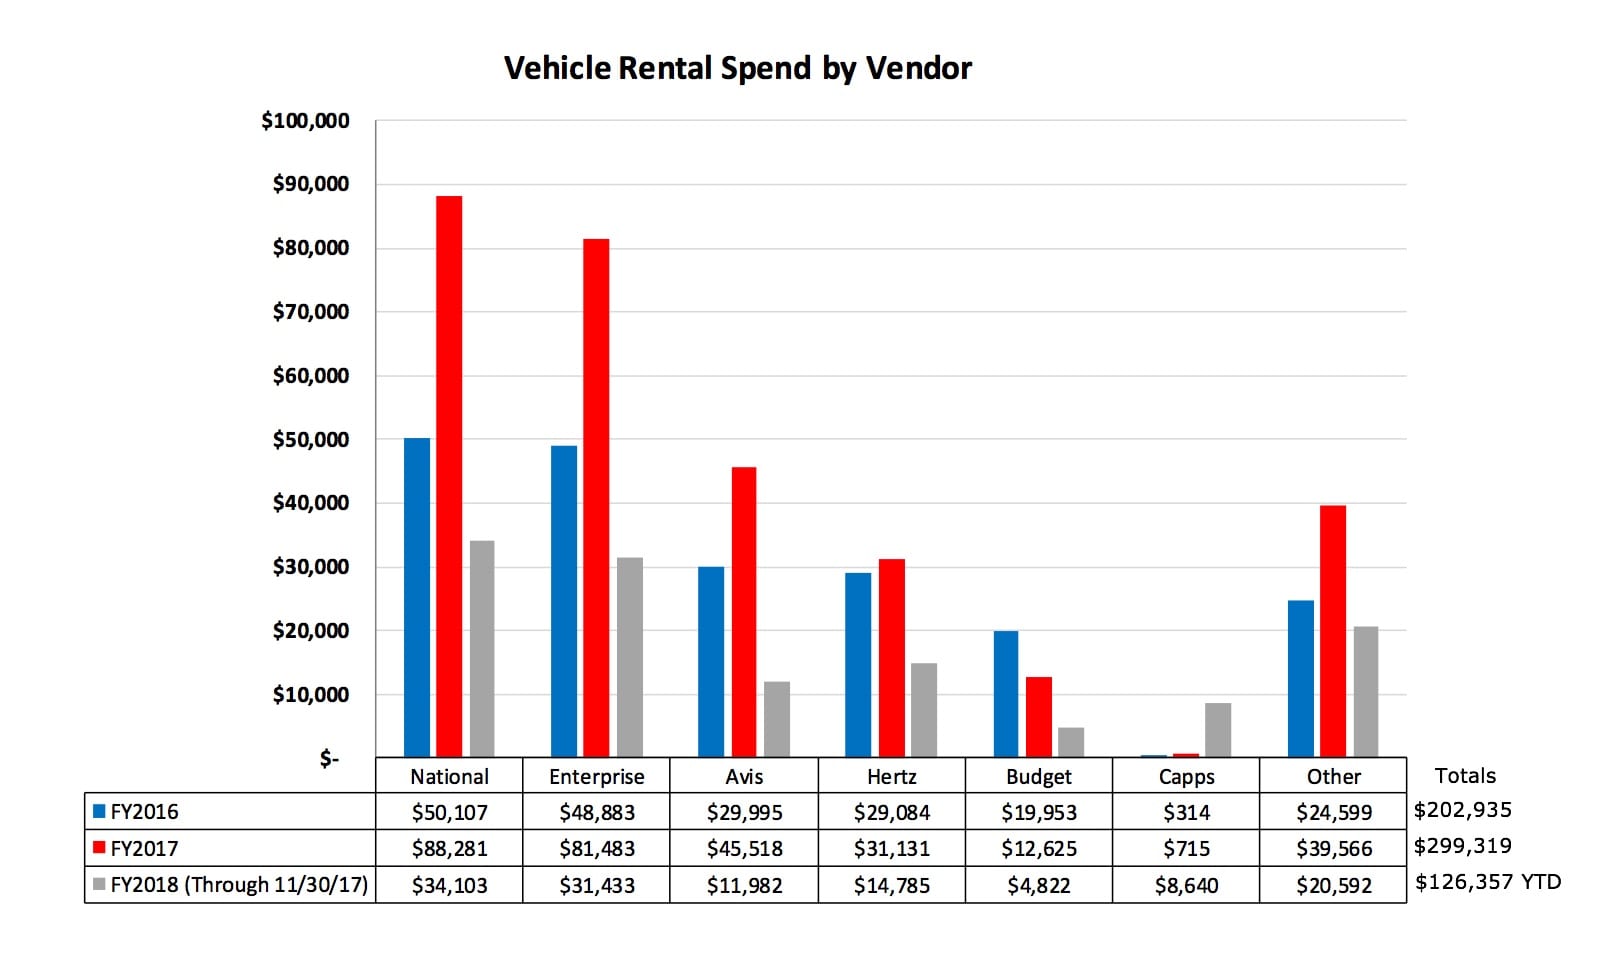
- Beginning in September 2016, a cooperative contract with Enterprise/National was loaded in Concur to show reduced pricing options.
- Contract was utilized for approximately 57% of all rental spend in FY 2017.
- Contract was utilized for approximately 52% of all rental spend through the second quarter of FY2018. The decline is due to several van rentals in Taos that were made with Enterprise in FY2017, but the vans were not available in FY2018, so a substitute vendor (Capps) was utilized. Excluding this anomaly raises the usage to 55%.
Cell Phones

- In June 2016, iPads were added for Parking and ID Card Services.
- In August 2016, several SMU PD data cards were added to the AT&T plan.
- In October 2016, Parking and ID Card Services purchased several iPads for use with the Giddyup service.
- In April 2017, Athletics purchased new phones.
- Goal: To support minimal number of SMU provided cell phones.

- The amounts spent in June FY2015 were less than the two months following due to refunds received for cell phones turned in.
- Occasional increase in monthly expense may indicate purchase of equipment and/or data overage charges.
- In September 2017, RLSH transferred to pay as you go plans and cancelled multiple devices.
- In November 2017, Park n Pony ordered additional iPads, which resulted in a higher billing due to the cost of the equipment.
- Goal: To decrease expense as much as possible.
Printers

- The importance of reducing machine count is primarily due to future replacement costs. For example, the average life of a personal printer is 8 years. Therefore, 12.5% of the printers need to be replaced annually. By the end of FY2017, we have reduced the number of printers by 1,590, which equates to approximately 199 printers that do not need to be replaced on an annual basis.
- If, for example, the average replacement cost is $300 per unit, this would translate to approximately $60,000 of annual cost avoidance.
- SMU covers toner, paper, supplies and maintenance cost for supported printers.
- Goal: To limit total count to a maximum of 1,000 supported units. This figure was determined by assigning an approximate 2.5:1 ratio of SMU employees to printer. The goal was reached in September 2016 and printer counts will be monitored to ensure that these do not go back up to above 1,000.
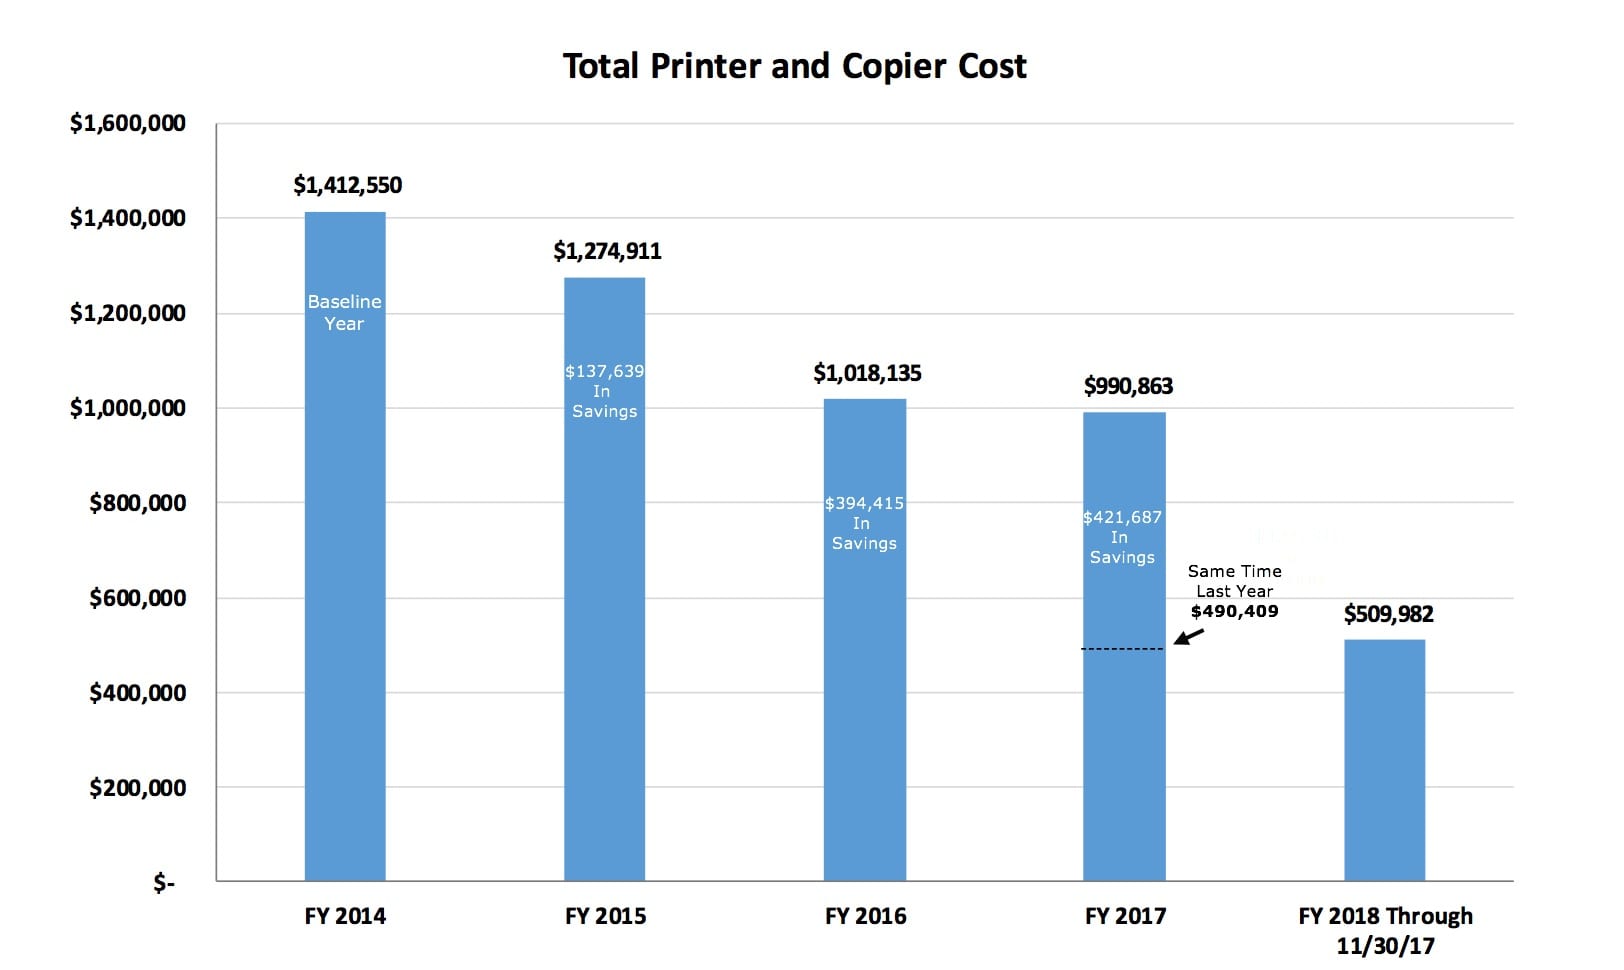
- Effective June 1, 2015, SMU entered into a Print Management Services agreement with a preferred vendor (Imagenet).
- Savings are calculated by comparing baseline fiscal year 2014 to each subsequent year.
- Figures for fiscal years 2014 and 2015 are estimates, as copier and printer equipment and supplies were sourced and purchased from multiple vendors and through various processes, making it impractical to track actual expenses.
- Goal: To continue to realize cost savings associated with printing and copy costs.
Office Supplies

- Average order size over $275 allows SMU to access the best contract pricing.
- Under the E&I contract effective April 1, 2017, the order size incentive of 1% is eliminated and rolled over to the annual volume rebate issued at the end of each contract year.
- Goal: To maintain an average order size of $275 and above to maximize delivery efficiency.

- Prompt pay was first achieved with the November 2015 invoice. With the implementation of the E&I contract effective April 1, 2017, the prompt pay discount was adjusted from 2% to 1%.
- This discount type is generally taken at time of payment.
- The benefit of the discount is allocated to the budget orgs that placed the corresponding orders.
- Goal: To receive the 1% discount on every invoice by paying the Staples invoices within the discount period

- With the implementation of the E&I contract effective April 1, 2017, SMU’s annual volume rebate increased from 1% to 1.5%.
- SMU receives the rebate in the form of a check, at the end of each contract year, based on total spend.
- As a result of SMU’s contract with Staples, SMU benefits from discounted pricing ranging from 5% to 75% off retail.
- Contract year is April 1 though March 31.
- The rebate is allocated to the budget orgs that placed the corresponding orders.
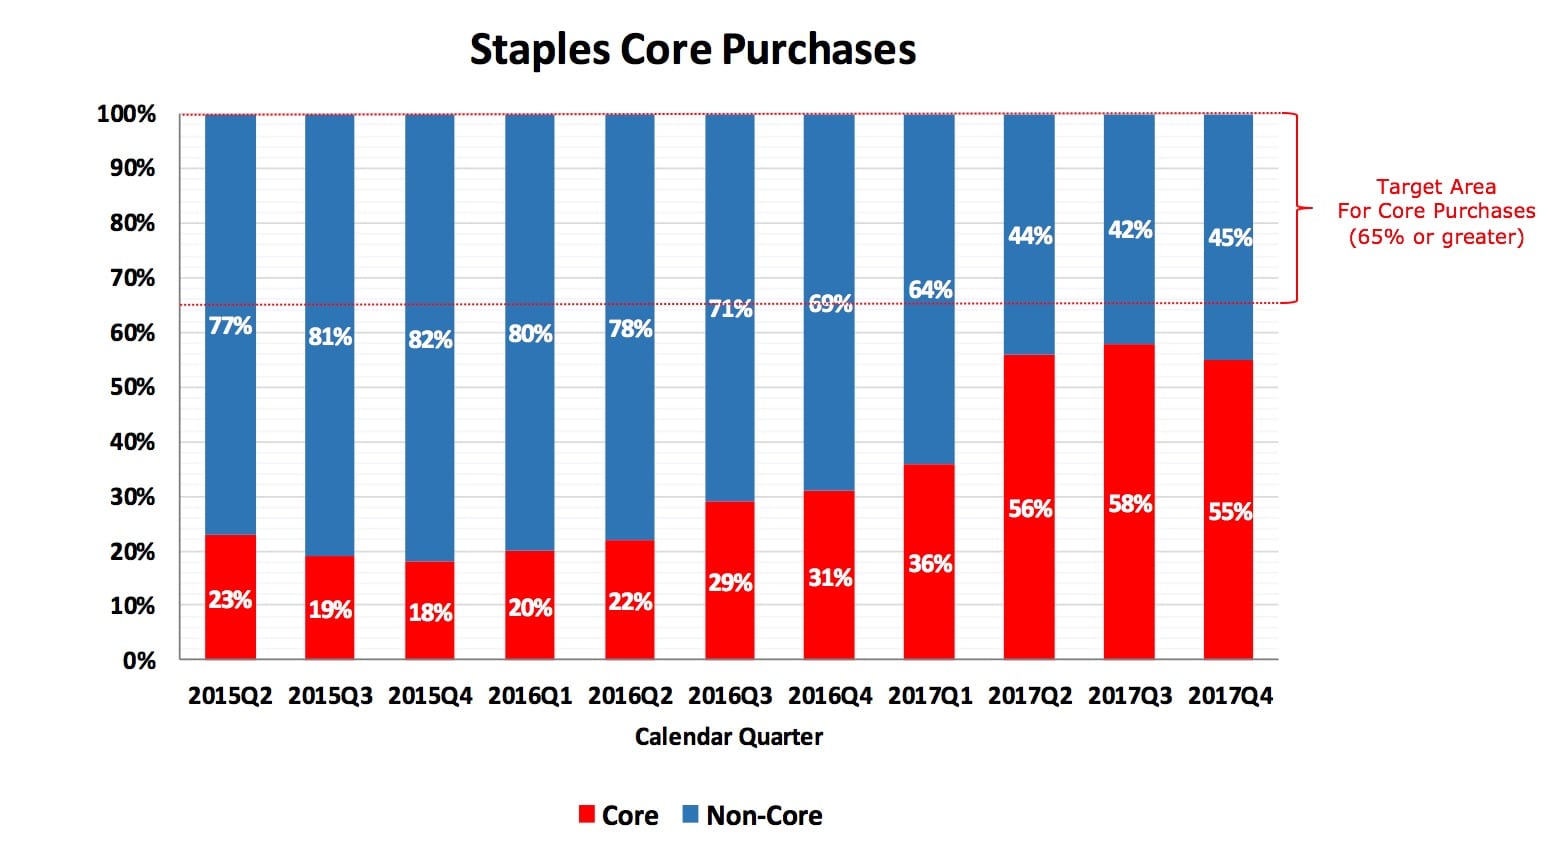
- Effective April 1, 2017, SMU entered into a new cooperative contract (E&I Cooperative Services), which allows SMU to recognize net savings of ~$46,000 per year based on an annual projected spend of $450,000. While rebate, order size and payment term incentives were reduced under the new contract, SMU will achieve higher net savings due to an expanded core list that is comprised of 11,000+ items (previously ~400 items).
- A review of commonly purchased items resulted in a range of savings between 2% – 27% – an overall savings of 12% when compared to the prior contract.
- Goal: To increase the percent of core purchases to realize the most savings. With the transition to the new contracting method, SMU will target 65% and above for core listed items.
Contracts
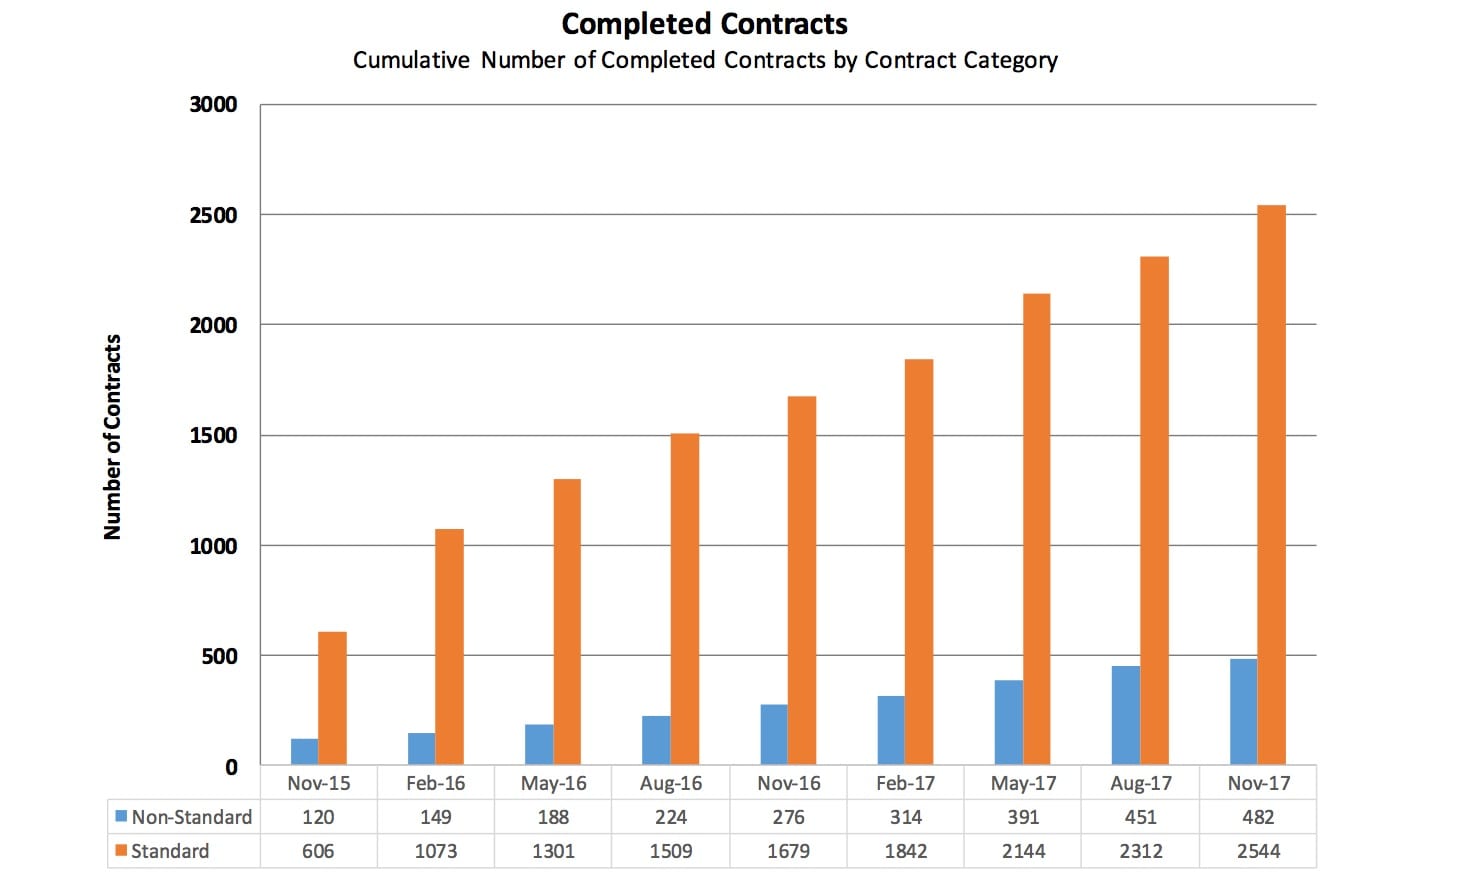
- Completed contracts reflect all contracts completed since the new contract administration process was implemented on April 15, 2015. Beginning in September 2015, SMU went live with Selectica’s Contracts Lifecycle Management software and contracts are now being reported with Selectica’s reporting feature. Prior to Selectica launching, contracts were tracked manually on spreadsheets.
- SMU Resources are departments and/or individuals with expertise in various areas of contract management.
- The Office of Legal Affairs (OLA) has prepared standard forms to be used across campus. If there are no special requirements or deviations from accepted OLA language, contracts can be processed for signature without review by SMU resources.
- Non-Standard contracts require review by appropriate SMU resources as necessary.
- This data does not include employment, endowment, grants and purchase orders which are outside of the new contract administration process.

- Completed Contracts reflect all contracts completed since the new contract administration process was implemented on April 15, 2015. Beginning in September 2015, SMU went live with Selectica’s Contracts Lifecycle Management software and contracts are now being reported with Selectica’s reporting feature. Prior to Selectica launching, contracts were tracked manually on spreadsheets.
- SMU resources are departments and/or individuals with expertise in various areas of contract management.
- The Office of Legal Affairs has prepared standard forms to be used across campus. If there are no special requirements or deviations from the accepted OLA language, contracts can be processed for signature without review by SMU resources.
- Non-Standard contracts require review by appropriate SMU resources as necessary.
- This data does not include employment, endowment, grants and purchase orders which are outside of the new contract administration process.

- Completed contracts reflect all contracts completed since the new contract administration process was implemented on April 15, 2015. Beginning in September 2015, SMU went live with Selectica’s Contracts Lifecycle Management software and contracts are now being reported with Selectica’s reporting feature. Prior to Selectica launching, contracts were tracked manually on spreadsheets.
- SMU resources are departments and/or individuals with expertise in various areas of contract management.
- Number of days in each of the SMU resources group reflects the time from the date a contract request was made to the resource group through the date of approval of the resources group.
- Effective August 2016, a new bar titled “Legal Negotiation” was added, which represents the average time period during which legal edits are being negotiated with vendors and/or their counsel. The bar titled “Legal Affairs” reflects the time from the date a contract request is made to the Office of Legal Affairs through the date of their initial redline/draft. Prior to July 1, 2016, Selectica was not set up to track a legal negotiation phase.

- Open Contracts reflect the total number of open contracts in the new contract administration process

- Open contracts in queue reflect the number of days on average for the remaining contracts that have not been completed according to their contract category.
- The open contracts could be in various stages of approval within the University or with the vendor or vendor’s counsel.
- The drop in days for non-standard contracts in September, 2016 was due to closure of a contract that had been open for 400+ days.
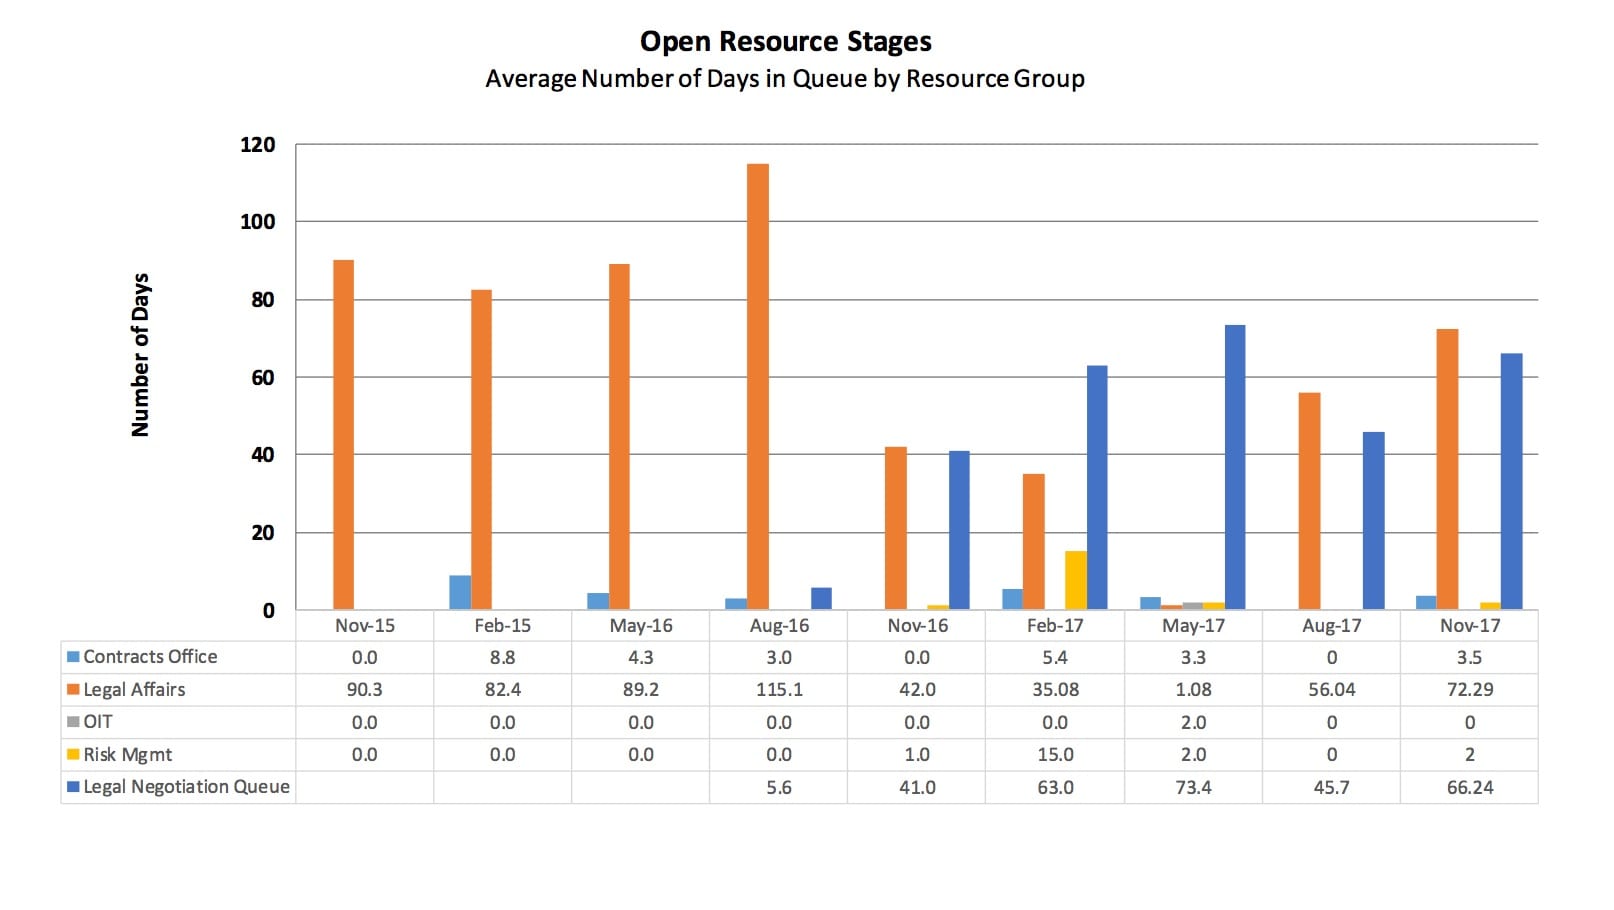
- Open contracts in queue reflect the number of days on average the remaining open contracts have been open according to the resource group.
- Number of days in each of the SMU resource groups reflects the time from the date a contract request was made to the resource group through the date of approval of the resource group.
- Effective July 1, 2016, the Legal Affairs bar includes a shaded area that represents the average time period during which legal edits are being negotiated with vendors and/or their counsel. The solid area of the bar reflects the time from the date a contract request is made to the Office of Legal Affairs through the date of their initial redline/draft. Prior to July 1, 2016, Selectica was not set up to track a legal negotiation phase.
IT
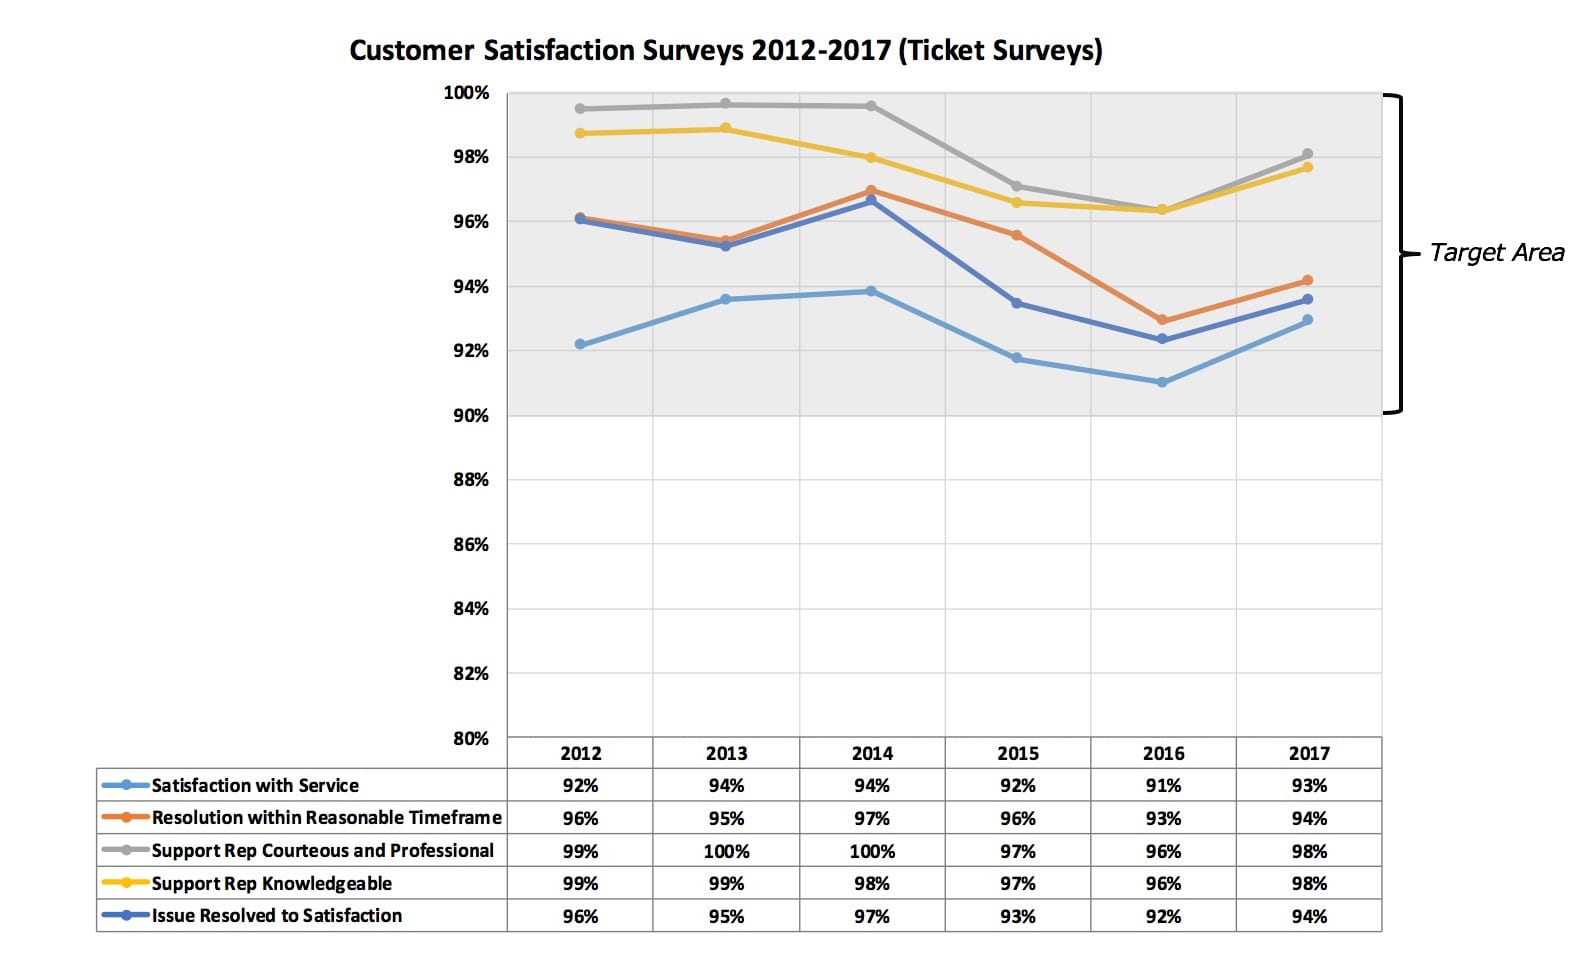
- Based on calendar year.
- A significant drop in the number of survey responses after 2013 is attributable to the fact that OIT drastically reduced the amount of surveys it sent out, due to feedback from a focus group that was conducted by HR and OIT.
- The minor drop in overall ratings in 2015 coincides with the shared services organizational design initiative being set in place.
- Goal: To maintain a 90% or higher satisfaction rate.
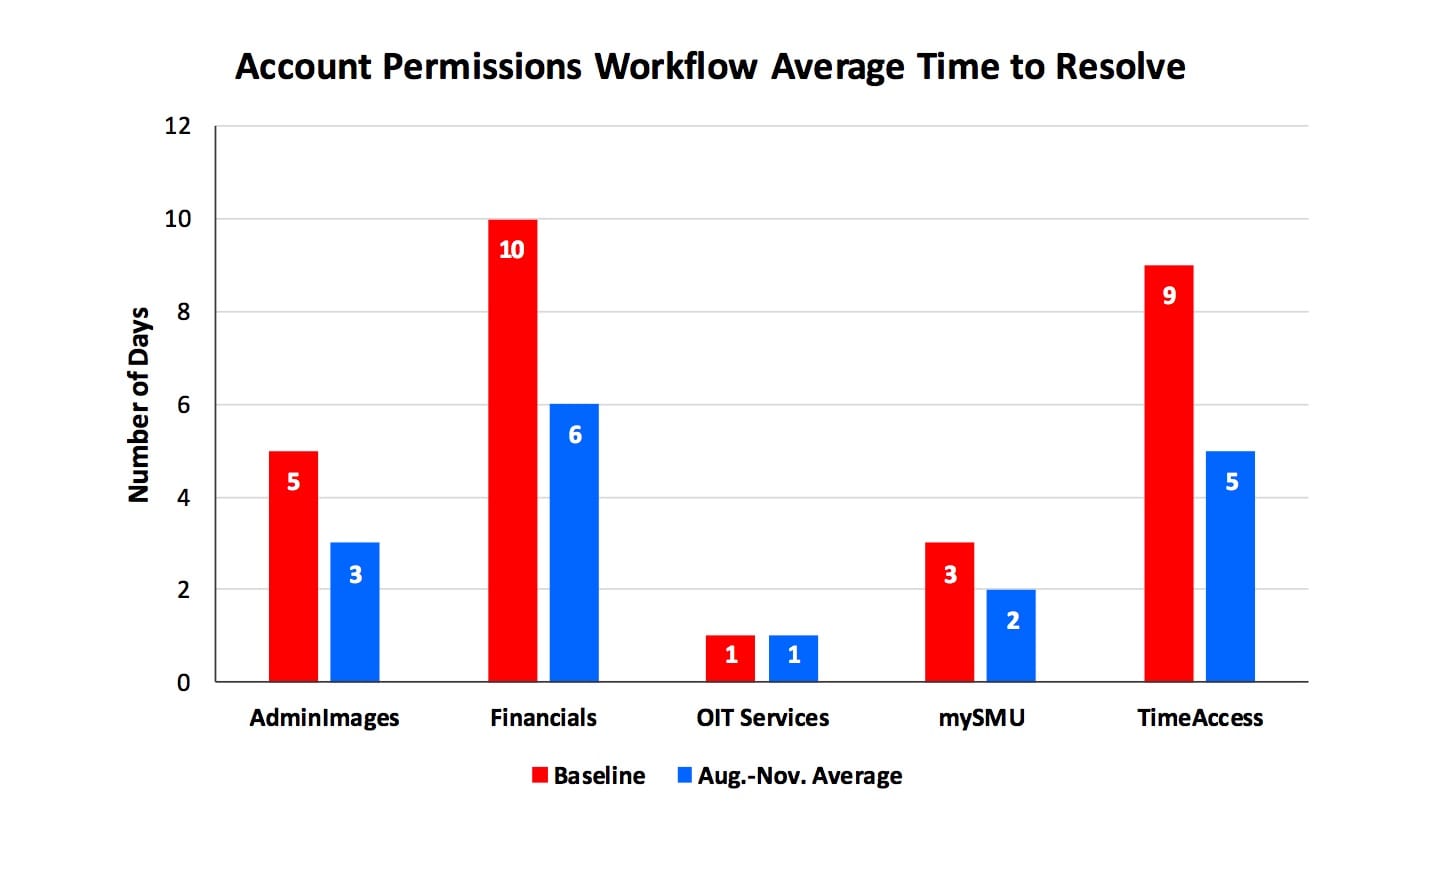
- The above numbers reflect the number of days to resolve help desk tickets requesting the assignment of unique permissions to an employee for various IT services.
- Services include network drives, blog, websites, SMU Financial, my.SMU and more.
- Goal: To reduce the number of days to resolve account permission requests.

- OIT began collecting survey data for classroom support emergency calls in January 2017.
- Goal: To attain the following ratings for each category:
- Minimized impact to instruction – 85% or higher
- Technician arrived in 5 minutes or less – 90% or higher
- Satisfaction with service – 90% or higher

- This metric tracks the rate at which incoming calls are answered without rolling to voice mail.
- The increase in percentage from 2011 to 2012 is potentially attributable to the fact that the voice mail option was removed for incoming help desk calls. This led to calls either being answered or abandoned by caller.
- Goal: To maintain a rate of 95% or higher.
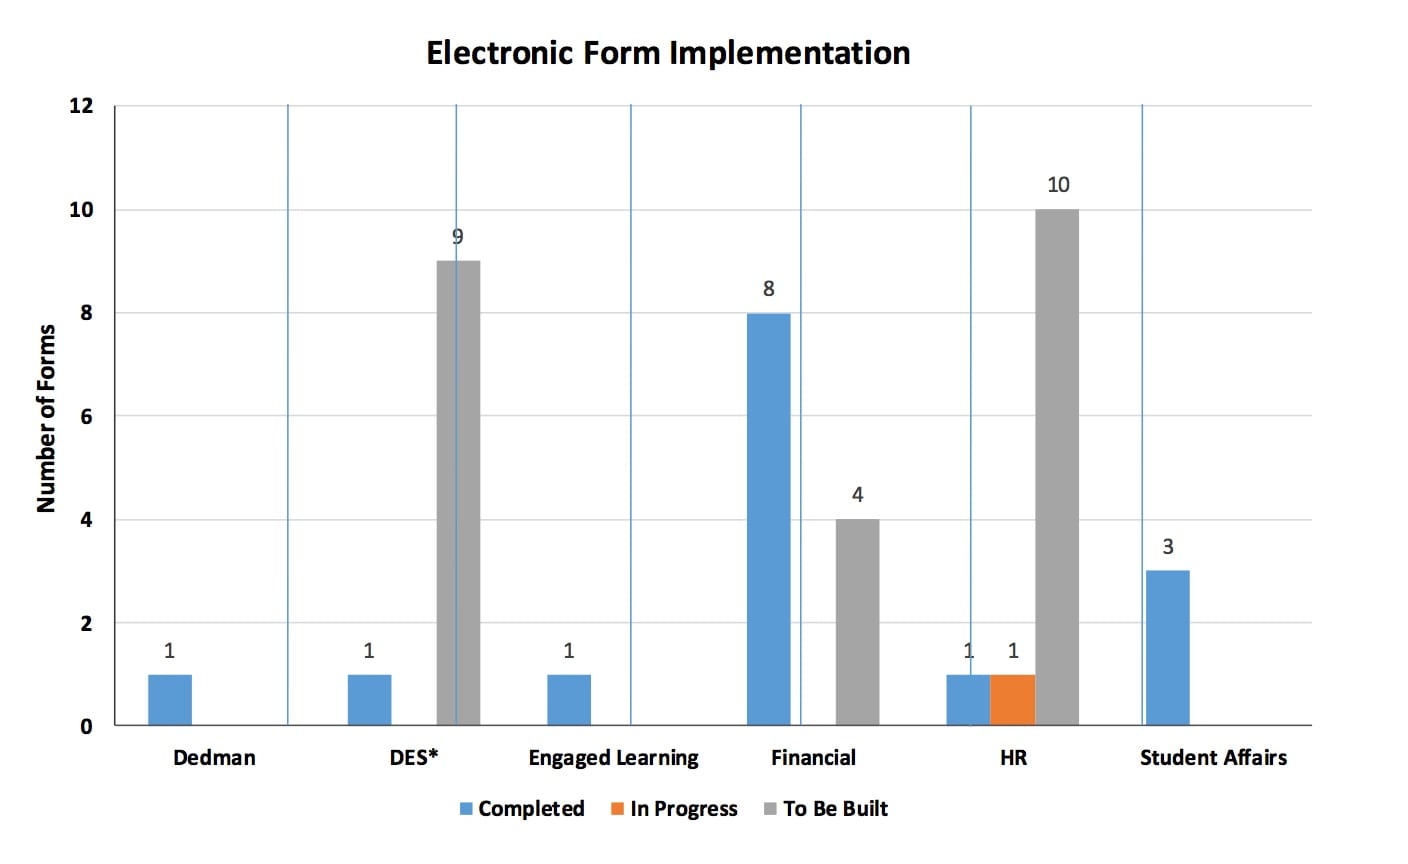
- *Division of Enrollment Services.
- E-form in progress: PAF (benefit eligible).
- Goal: An increase of e-form implementations, which will create a more efficient workflow.
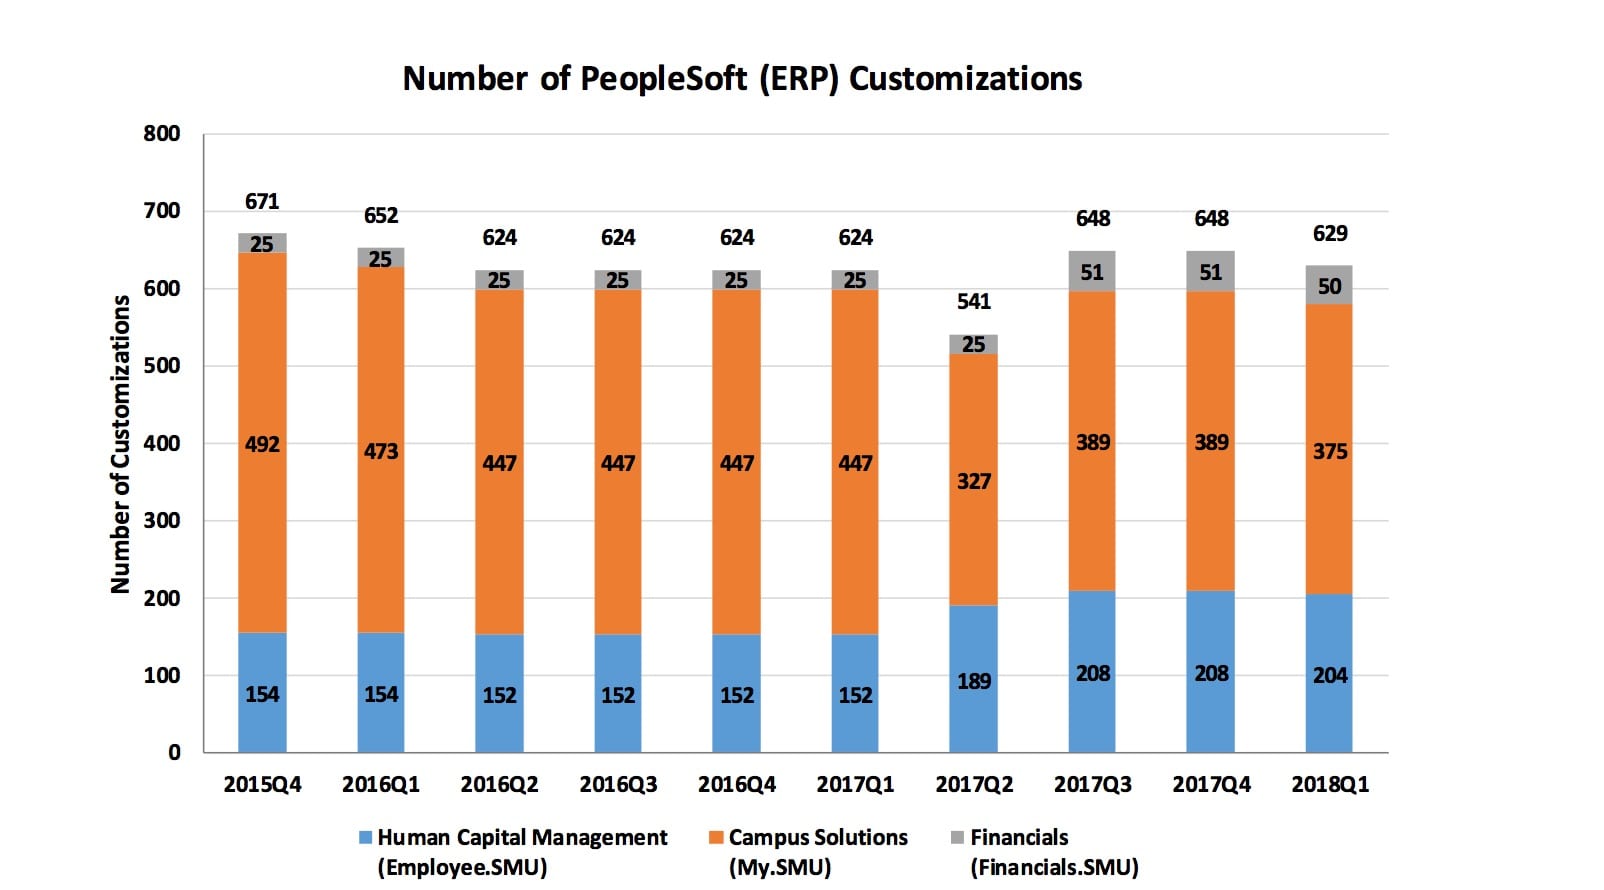
- Based on calendar year.
- OIT has recently begun a project to upgrade the Campus Solutions system and will examine customizations in that process. The first phase in the project is called “fit gap” and should start to examine how delivered functionality from PeopleSoft can be exploited.
- The increase in Human Capital Management in 2017Q2 is due to customizations that were previously assigned to employees that are no longer with SMU.
- The increase in customizations in 2017Q3 is attributable to the fact that OIT began documenting every change ever made to the system since its inception (approximately 20 years ago). As a result, previously undocumented customizations are being discovered, which has increased the inventory.
- Goal: To reduce the total number of customizations performed on the ERP system.
Finance

- Fiscal year-to-year comparison.
- Beginning June 2016, there was a reduction of several thousand JE lines due to Facilities reducing volume from their department.
- Since the elimination of cross charges, there has been a reduction of several thousand JE lines.
- The spike in volume that occurs in May of each year is due to fiscal year end journal entries.
- Goal: To reduce the number of manual journal entries processed.

- Fiscal year-to-year comparison.
- In the first quarter of FY 2017, the Accounts Payable department initiated testing, on a limited test group, an initiative whereby vendor invoices are received centrally to Accounts Payable, at which point an electronic approval workflow is initiated. The goal of this initiative is to shorten the period during which an invoice makes its way through various coding/approval channels before arriving in A/P for processing and payment. With the electronic approval mechanism that this workflow provides, approvers can view and approve invoices on their mobile device and forward on to the next approver in the workflow and so forth, until the approved invoice arrives, in electronic form, to A/P for processing.
- As of April 2017, centralized receipt of invoices was implemented for all academic areas.
- In December 2017, there were several vendors who submitted batches of invoices with dates that went back as early as March of the same year. It was not clear if these invoices were held at the various departments or if the vendors resubmitted them for payment.
- Goal: To reduce the number of days between invoice date and receipt of invoice in A/P.

- Fiscal year-to-year comparison.
- Goal: To reduce the number of days between receipt of invoice in A/P and date invoice entered into system

- Fiscal year-to-year comparison.
- Beginning on December 5th, 2017, the A/P department started processing check runs Monday through Thursday, as opposed to only Monday and Wednesday, which was the previous practice.
- Beginning on January 9th, 2017, the A/P department started processing check runs Monday through Friday. As a consequence, this metric will likely show an increase in the average number of days due to a large percentage of invoices being entered well before their due dates. However, the benefit of more frequent check runs is that invoices that are received in A/P with immediate due dates will be paid in a much more promptly – effectively 4 days sooner than under the previous schedule in some cases.
- Goal: To optimize the number of days between invoice entered in A/P and payment date.

- Fiscal year-to-year comparison.
- In the first quarter of FY 2017, the Accounts Payable department initiated testing on an initiative whereby vendor invoices are received centrally to Accounts Payable, at which point an electronic approval workflow is initiated. The goal of this initiative is to shorten the period during which an invoice makes its way through various coding/approval channels before arriving in A/P for processing and payment. With the electronic approval mechanism that this workflow provides, approvers can view and approve invoices on their mobile device and forward on to the next approver in the workflow and so forth, until the approved invoice arrives, in electronic form, to A/P for processing.
- In December 2017, there were several vendors who submitted batches of invoices with dates that went back as early as March of the same year. It was not clear if these invoices were held at the various departments or if the vendors resubmitted them for payment.
- In December 2017, there was a high volume of unclaimed property that was reissued, which was a factor in the increase in average days.
- Goal: Since most invoices have 30 day terms, an ideal average number of days for this metric is approximately 30.
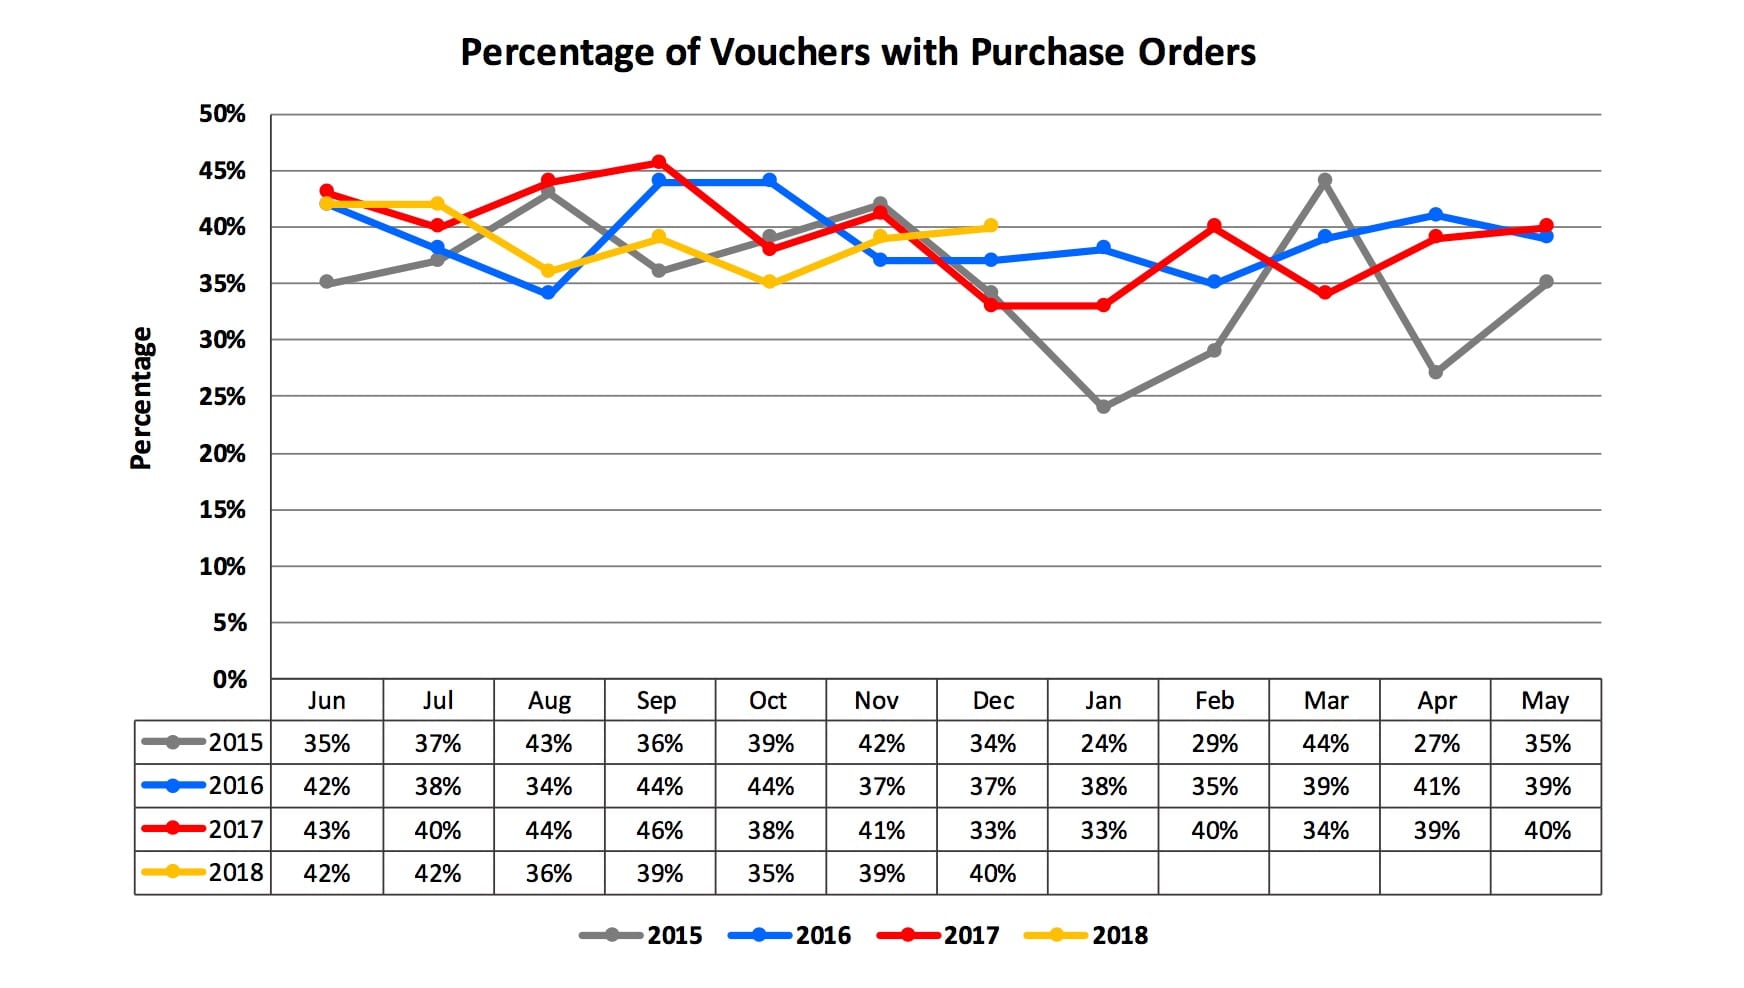
- Calculation is based on all regular vouchers greater than $5,000 and grants greater than $3,000.
- As more and more vouchers have corresponding purchase orders, efficiency will rise due to the fact that incoming invoices will be processed without spending valuable time figuring out who ordered the products or services, obtaining approval and account coding.
- Goal: To increase the percentage of vouchers with purchase orders.
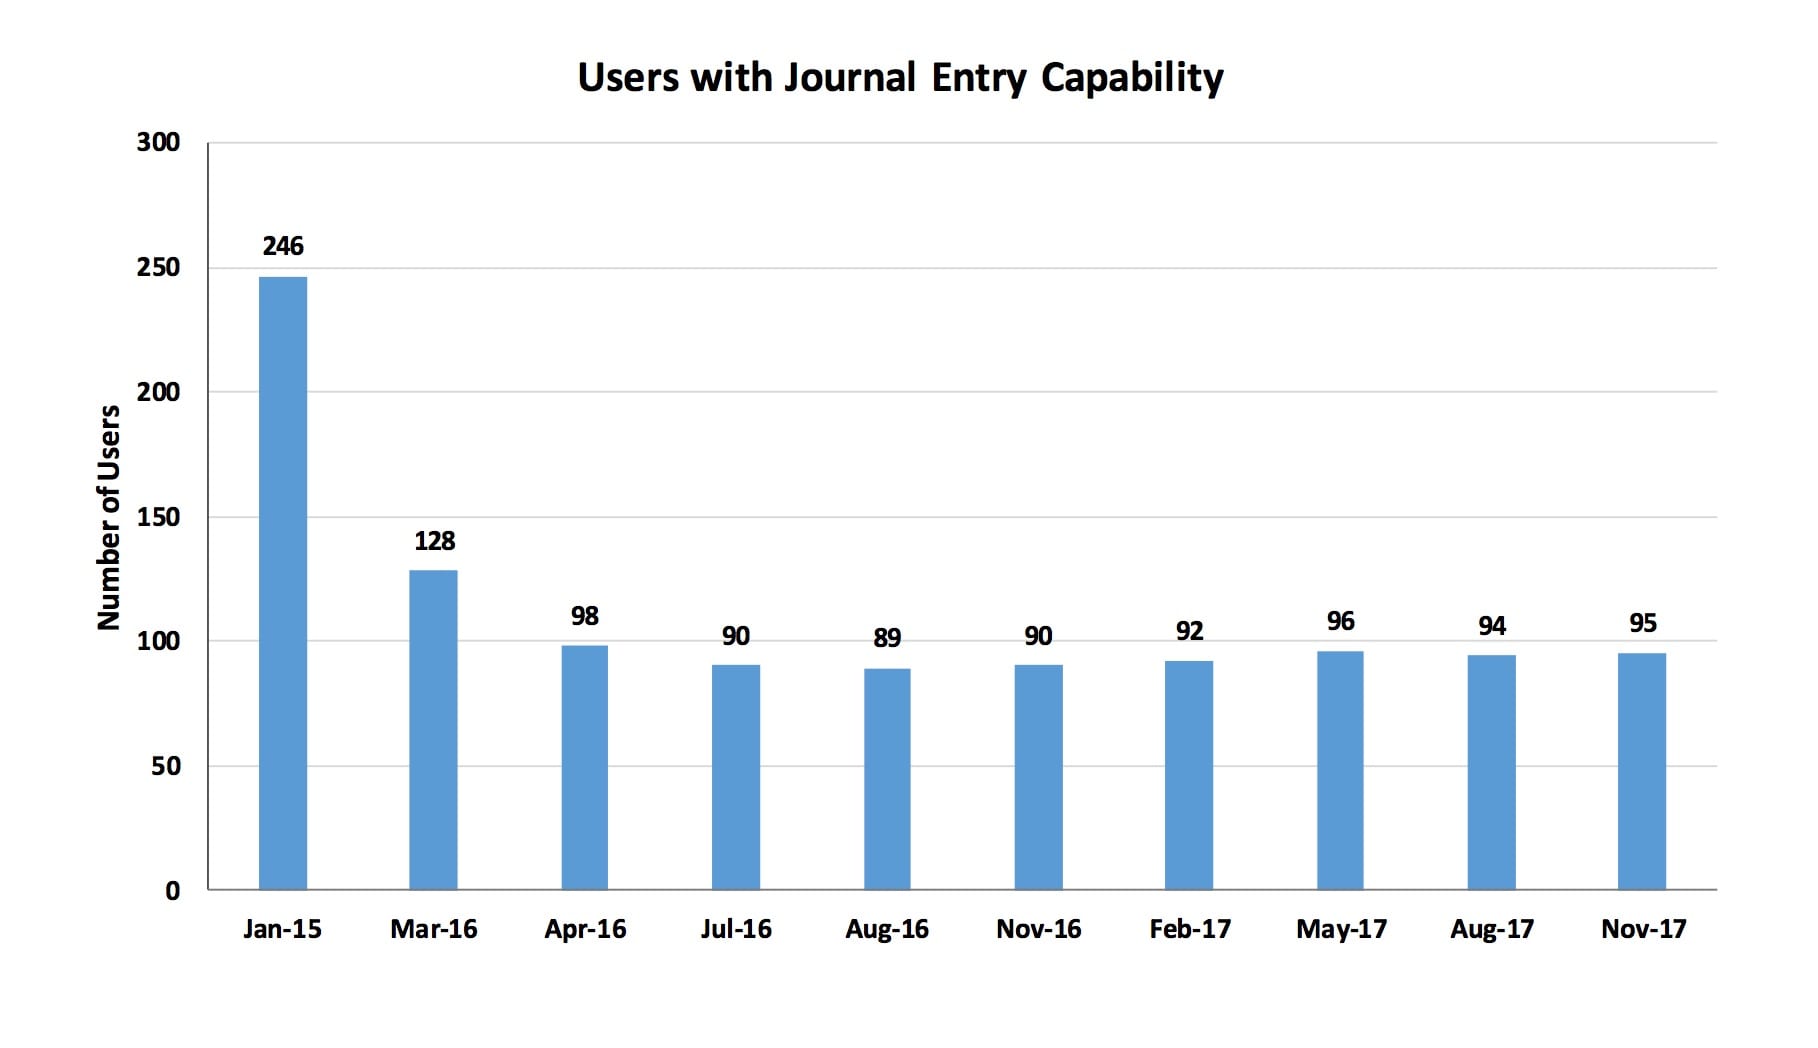
- Journal entry capability was removed from users in various phases, which did not occur at regular intervals. Therefore, the dates above do not follow a particular pattern.
- Goal: To reduce the number of manual journal entries and to increase controls and data input accuracy and consistency.

- Electronic payments include online credit card, electronic check and wire transfer payments.
- Cashiering payments include incoming paper checks and cash.
- The processing of paper checks is very labor intensive, as such payments must be processed manually and bank deposits need to be prepared. By receiving electronic payments, this process is automated.
- By minimizing manual processing associated with cashiering payments, staff is able to use time more effectively by focusing on providing service to students and working to collect outstanding student balances.
- Goal: To increase the percentage of electronic payments.

- The Bursar’s Office started offering electronic refunds for student accounts beginning July 1, 2016.
- Students are informed about the electronic refund process during their orientation session, which is conducted through Academic Advising, Registration, and Orientation (AARO).
- Main benefits of using ACH payments:
- (1)Cost savings: Cost per ACH is $0.95 and per paper check is $2.95.
- (2)Time savings: Paper checks use up valuable time with lost checks, stop payments, re-issuing of lost checks, checks that are never cashed and have to eventually be voided, etc.
- In Summer 2017, SMU transitioned to a new vendor for refund processing. Therefore, there was a drop in the percentage of electronic refunds during the Fall 2017 semester. It is expected that the percentage of electronic refunds will increase over time.
- Goal: To have 75% of all refunds for student accounts converted from paper check to electronic payments by July 2018.
Facilities

- The data presented excludes: RLSH Apartments, Greek Houses, East Campus, Plano Campus & Taos Campus. These buildings are excluded because the square feet for this slide relate only to electricity and natural gas fed from the Central Plant and the multi-stack system in the Mustang Parking Center.
- Energy Use Intensity (EUI) is the measure of how much electricity and natural gas is used per gross square foot per year.
- EPA’s Energy Star indicates that the national median site EUI for a four-year university is 131 kBTU/GSF/Yr.
- Weather will influence energy usage, from unusually hot summers to severe cold winters, and will impact how much energy is used per square foot from year to year.
- Goal: To maintain low energy cost and an EUI that is below the national median for a four-year university.
- The importance of reducing machine count is primarily due to future replacement costs. For example, the average life of a personal printer is 8 years. Therefore, 12.5% of the printers need to be replaced annually. By August 2016, we have reduced the number of printers by 1473, which equates to approximately 184 printers that do not need to be replaced on an annual basis.
- If, for example, the average replacement cost is $300 per unit, this would translate to just above $55,000 of annual cost avoidance. Once the machine count is reduced to 1000, the estimated annual cost avoidance figure will be approximately $56,000.
- Ongoing review and evaluation of the campus print environment will allow SMU to reduce the fleet to 1000 supported printers.
- SMU covers toner, paper, supplies and maintenance cost for supported printers.
- Goal: To reach 1000 supported units. This figure was determined by assigning an approximate 2.5:1 ratio of SMU employees to printer. It is estimated that the goal of reducing printers to 1000 will be reached by September 2016.

- The data presented excludes: RLSH Apartments, Greek Houses, East Campus, Plano Campus & Taos Campus. These buildings are excluded because the square feet for this slide relate only to electricity and natural gas fed from the Central Plant and the multi-stack system in the Mustang Parking Center.
- Weather will influence energy usage, from unusually hot summers to severe cold winters and will impact how much energy is used per square foot from year to year.
- The increase in GSF from 2014 to 2015 is attributable to the new residential commons, Arnold dining, and the 800-space parking center being added.
- Goal: To maintain low energy cost.
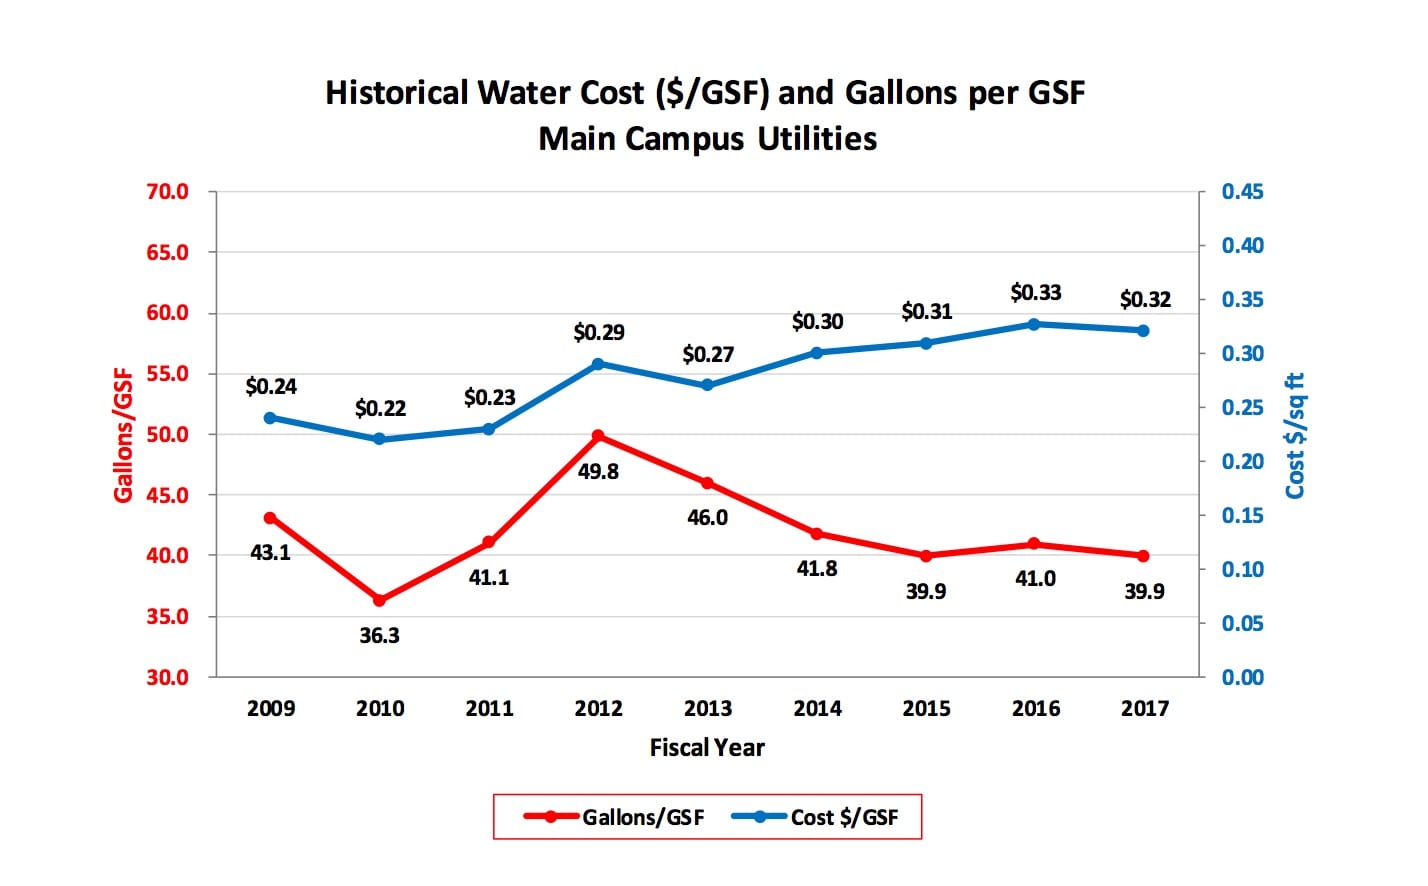
- The data presented excludes: RLSH Apartments, Greek Houses, Tennis Courts, University Data Center, East Campus, Plano Campus & Taos Campus. These are excluded because the square feet for this slide specifically relate to water fed from the three water meters for the main campus.
- The high water usage during fiscal years 2012 and 2013 is attributable to a combination of unusually high temperatures and low levels of annual precipitation.
- Goal: To maintain water usage below 50 gallons per gross square foot per year.
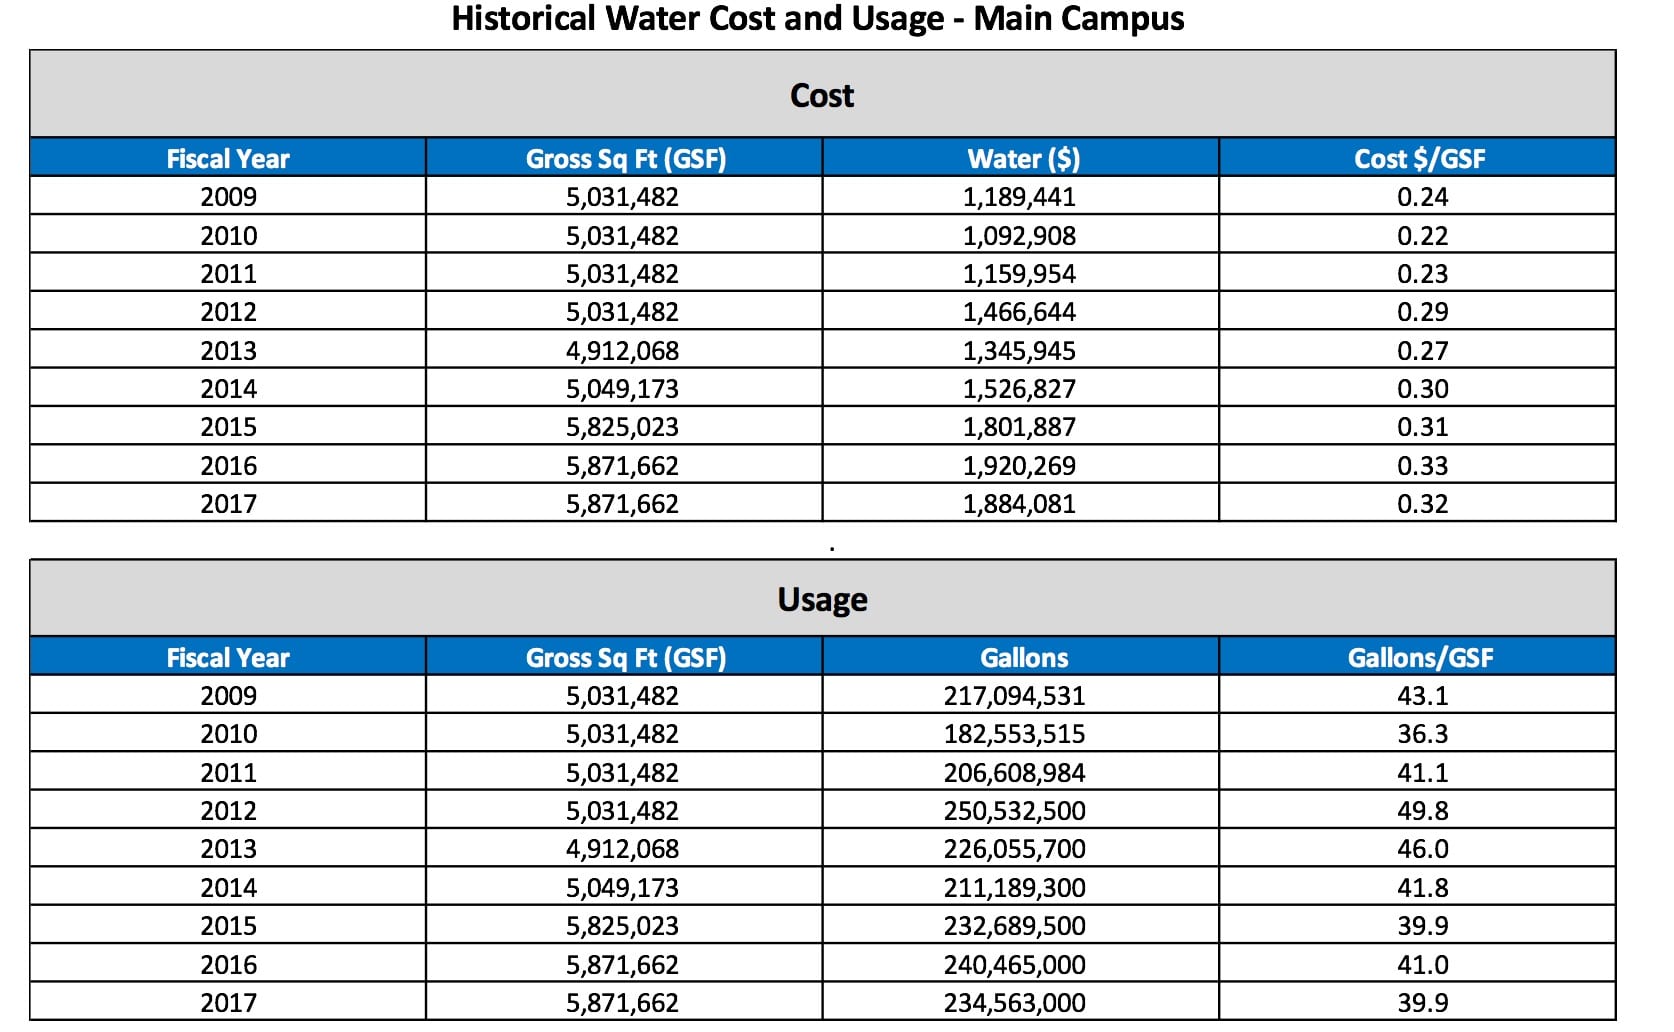
- The data presented excludes: RLSH Apartments, Greek Houses, Tennis Courts, University Data Center, East Campus, Plano Campus & Taos Campus. These are excluded because the square feet for this slide specifically relate to water fed from the three water meters for the main campus.
- The increase in GSF from 2014 to 2015 is attributable to the new residential commons, Arnold dining, and the 800-space parking center being added.
- The high water usage during fiscal years 2012 and 2013 is attributable to a combination of unusually high temperatures and low levels of annual precipitation.
- Goal: To maintain water usage below 50 gallons per gross square foot per year.

- Precipitation data is collected from the National Oceanic and Atmospheric Administration (NOAA) weather station at Love Field Airport.
- Weather conditions will affect the main quad’s water usage, in that, during seasons of drought, more water will be required. Conversely, during seasons of above average precipitation, less water will be required to irrigate the main quad. Therefore, the goal to reduce usage is set at a range in order to accommodate the effects of weather. In addition, SMU requires that the main quad remain green year round, which is also a contributing factor to water usage.
- Conversion from rotary type irrigation sprinkler heads to sprayer irrigation sprinkler heads for reduction of water consumption in the Main Quad was completed in mid-August 2016.
- Goal: To reduce main quad irrigation to below 5.2 million gallons/fiscal year based upon FY2014 usage of 6.4 million gallons of water.
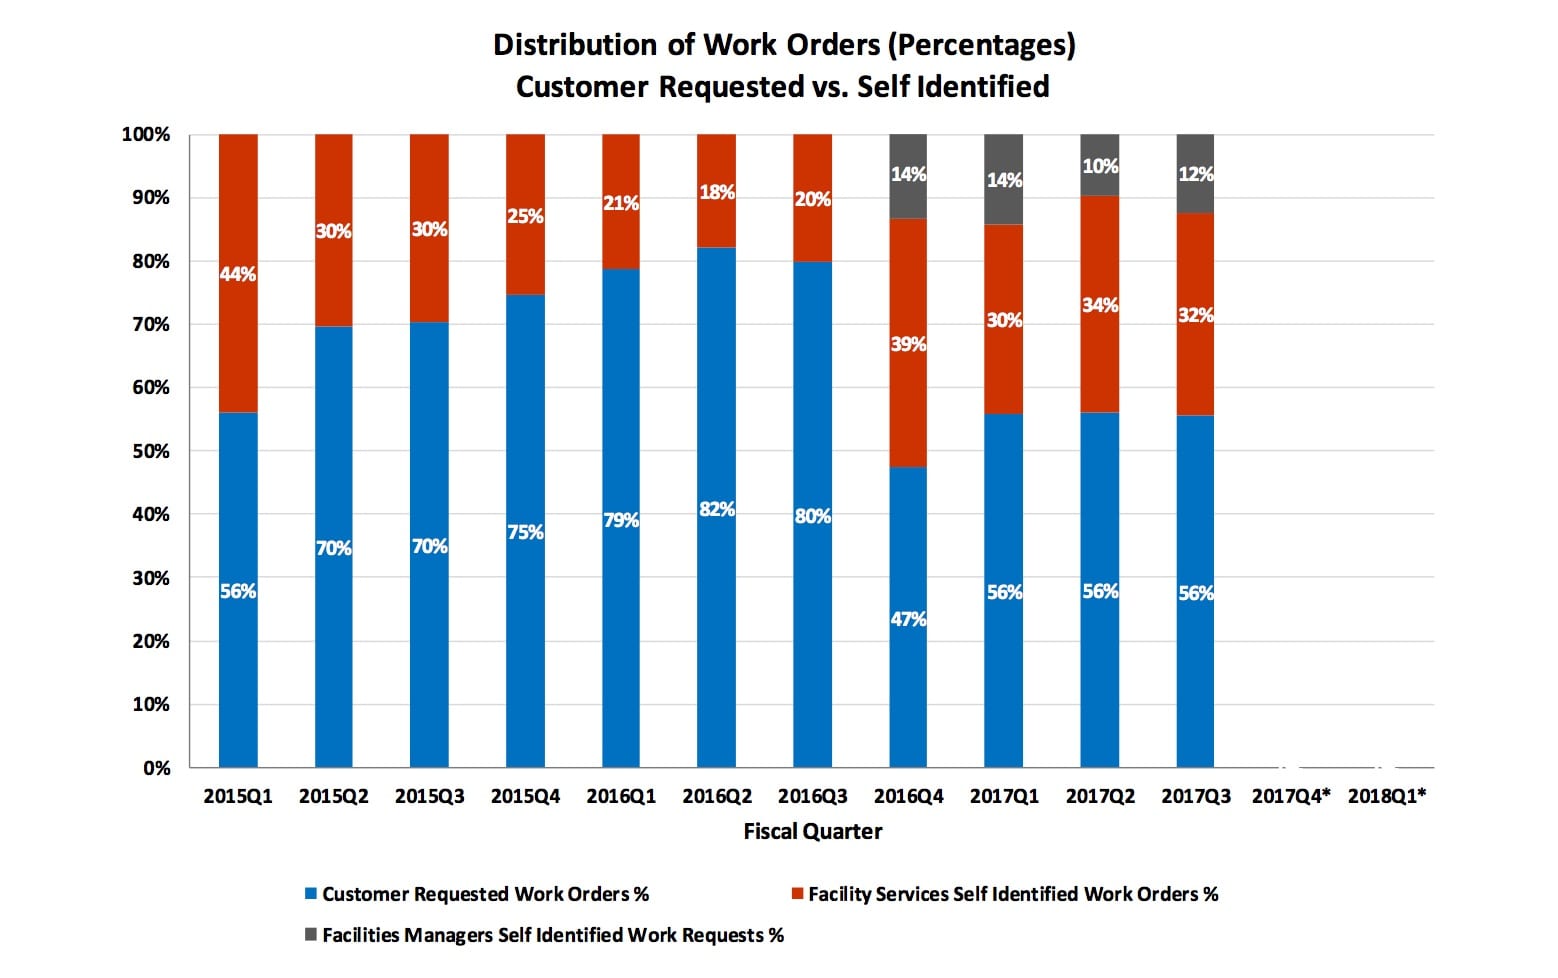
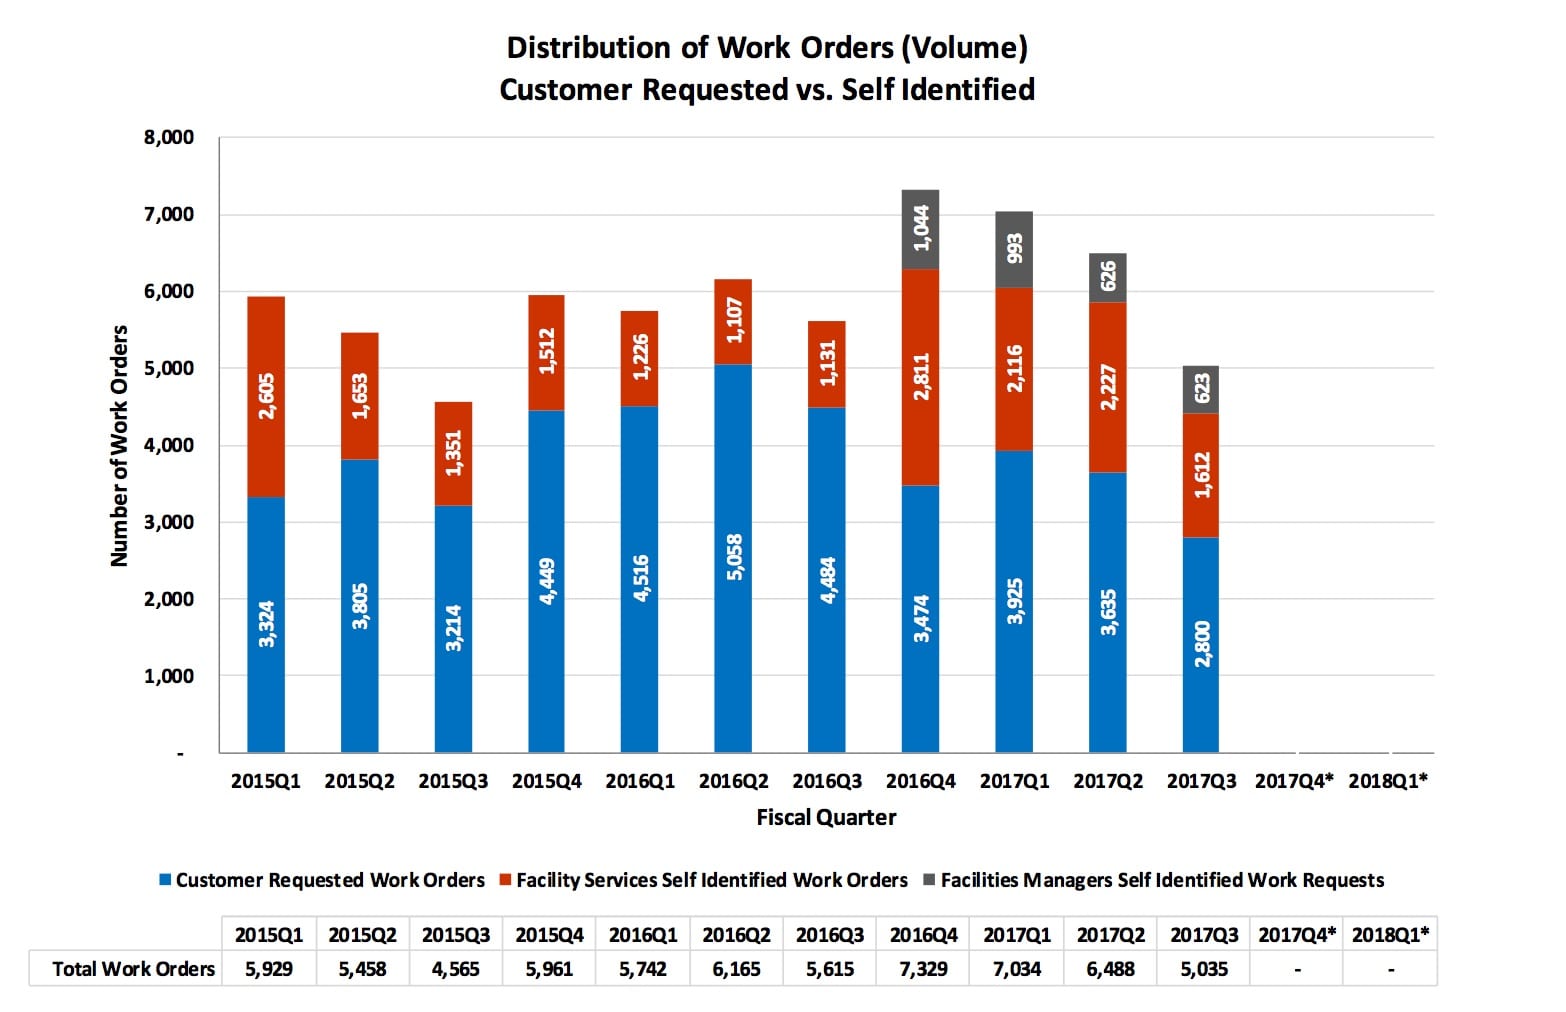
- Includes all Base Services and Additional Services work orders. Additional Services work orders impact the results due to their unplanned, unforeseen and out-of-sequence nature.
- Excluded: Preventive Maintenance Work orders and SMU in Taos.
- Facilities Managers started submitting self identified work requests in the computerized maintenance management system on March 1, 2016.
- *Beginning 2017 Q4, data was not available due to a change in service provider.
- Goal: To continually see a decline in customer requested work orders to attain a level not to exceed 50%.

- Includes all Base Services and Additional Services work orders. Additional Services work orders impact the results due to their unplanned, unforeseen and out-of-sequence nature.
- Effective May 1, 2016, surveys issued on all non-self-identified work orders. From June 1, 2015 – April 30, 2016 surveys issued on every 3rd non-self-identified work order.
- *Beginning 2017 Q4, data was not available due to a change in service provider.
- Goal: To maintain a customer average score between Excellent (1) and Good (2).
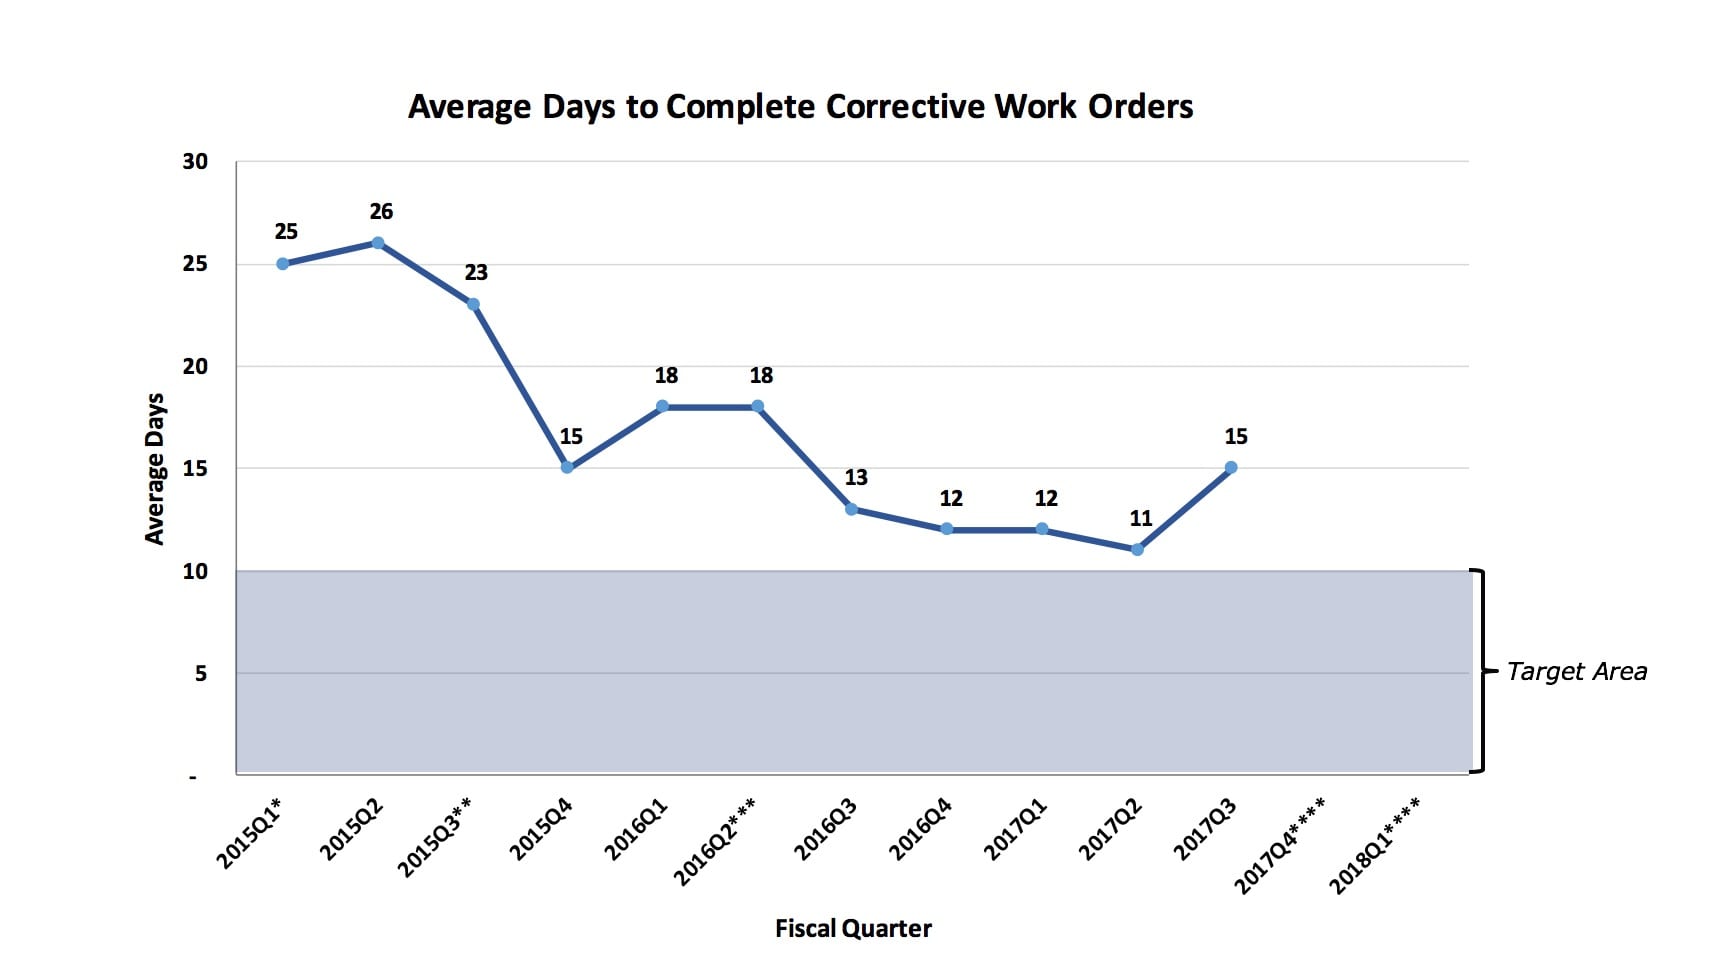
- Includes all Base Services and Additional Services work orders. Additional Services work orders impact the results due to their unplanned, unforeseen and out-of-sequence nature.
- *New CMMS System rolled out (TMA) in 2015Q1.
- **Procedural change in the beginning of 2015Q3 to close open work orders.
- ***Procedural change in the beginning of 2016Q2 to allow technicians to close work orders in real time.
- ****Beginning 2017 Q4, data was not available due to a change in service provider.
- Goal: To complete corrective work orders within an average of 10 calendar days.

- Includes all Base Services and Additional Services work orders. Additional Services work orders impact the results due to their unplanned, unforeseen and out-of-sequence nature.
- Excluded: Preventive Maintenance Work orders and SMU in Taos.Staff/Faculty counts used for calculating this metric are obtained
- from SMU’s Institutional Research website.
- *Beginning 2017 Q4, data was not available due to a change in service provider.
- Goal: To minimize and keep average customer submitted work orders under 1 per SMU FTE (Faculty & Staff) per fiscal quarter
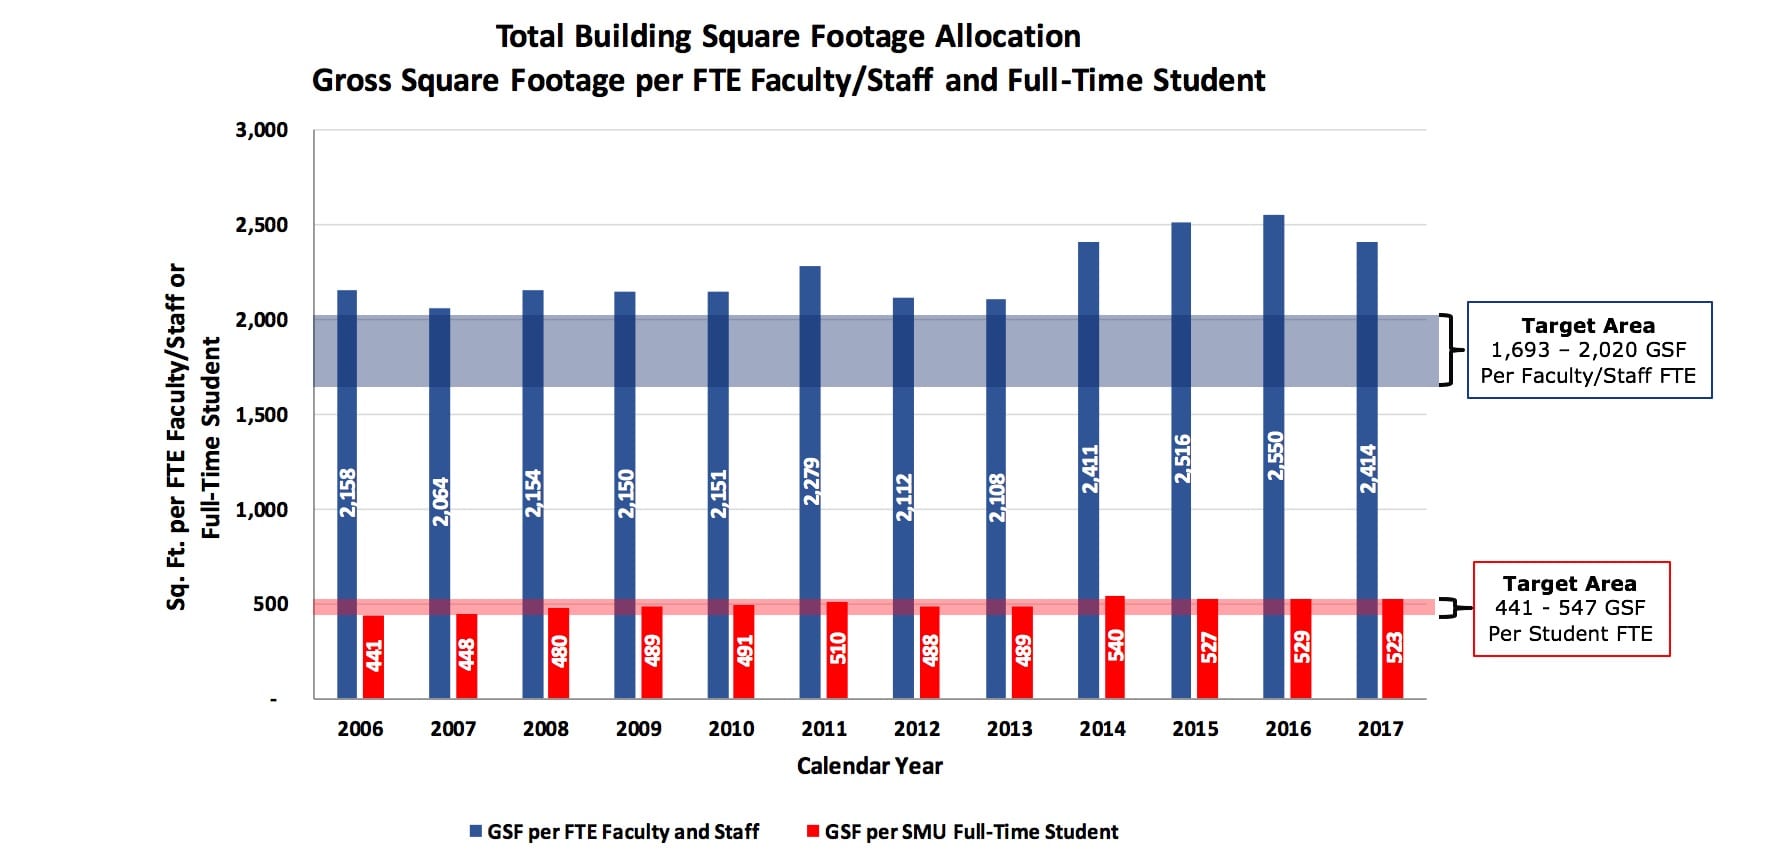
- For 2006-2015: Gross square footage (GSF) includes attic space. Does not include the following: Plano, Taos, grounds assets, single family houses, apartments, President’s house, Sigma Chi, commercial and retail properties, 80% of Johnson Square, surface parking lots, Athletic Courts, Athletic Fields, Recreational Courts and Recreational Field.
- For 2016: Gross square footage (GSF) includes attic space. Does not include the following: Plano, Taos, grounds assets, single family houses, apartments, President’s house, Sigma Chi, commercial and retail properties, 64% of Johnson Square, 52% of Expressway Tower, surface parking lots, Athletic Courts, Athletic Fields, Recreational Courts and Recreational Field.
- For 2017: Gross square footage (GSF) includes attic space. GSF was recalculated based of AutoCAD plan calculations. Does not include the following: Plano, Taos, grounds assets, single family houses, apartments, off-campus assets, President’s house, Sigma Chi, commercial and retail properties, 55% of Johnson Square, 52% of Expressway Tower, surface parking lots, Athletic Courts, Athletic Fields, Recreational Courts and Recreational Field.
- Information for faculty/staff FTE and student FTE cited from SMU’s Office of Institutional Research website. Information for GSF provided by SMU’s Office of Facilities Planning and Management.
- Target areas for the two categories are based on benchmarking against peer institutions. Calculations were made using information found on Vanderbilt’s and TCU’s websites, as follows: (1) Vanderbilt (Aspirant) – 6,900,000 SF, 4,075 faculty/staff and 12,605 students for the fall of 2015. This equates to 547 SF per student FTE and 1,693 SF per faculty/staff FTE, and (2) TCU (Cohort) – 4,476,119 SF, 2,206 faculty/staff and 10,143 students for the fall of 2015. This equates to 441 SF per student FTE and 2,029 SF per faculty/staff FTE.
- Goal: To maintain a square footage ratio per student FTE and per faculty/staff FTE within the total square footage ratios of SMU’s cohort and aspirational institutions, TCU and Vanderbilt, respectively.