
Created to improve operations at SMU and identify savings in administrative costs to reallocate to academic purposes, the Office of Operational Excellence has identified key measurements to track progress towards its mission.
At the beginning of the Operational Excellence for the Second Century (OE2C) project, research revealed that our peers across aspirational universities are spending a greater percentage of funds on the academic mission versus administration costs. To measure SMU’s progress toward achieving a competitive balance of academic and administrative spending through bold initiatives that serve the staff, faculty, and students, the Office of Operational Excellence has identified a set of key metrics.
Below, you’ll find key metrics from OIT including the following Q&A with team leaders.
Why were these particular performance metrics chosen to represent progress toward operational excellence in your area?
We selected a few key metrics that would help capture customer satisfaction or efficiency improvements in OIT.
Percentage of calls answered: As customers are encouraged to contact the IT Help Desk for any request, it is imperative that calls are answered quickly. If customers can’t get through the phone line or abandon the call due to a long wait time, that would indicate a problem with staffing at the front line. Our help desk staff covers a large number of hours, seven days a week. Ensuring that the percentage of calls answered remains high, means that customers are able to reach us consistently for assistance.
Customer Satisfaction: When tickets are closed in our help desk tracking system, a survey is sent on a randomized basis. Customers are encouraged to provide feedback regarding the service they receive. We are monitoring several areas of customer service to ensure we are providing excellent service to the campus community. The customer satisfaction score reflects responses for any ticket in the help desk system—not just those resolved by the help desk. This helps capture the service from the front line all the way to senior IT administrators.
Classroom Support: Rapid response and resolution to classroom technology issues is a critical service to the faculty and students at SMU. We are working on several solutions to help eliminate or drastically reduce the resolution time for these types of issues. The metrics are monitoring progress as these solutions are implemented.
How do these metrics support the work of your OE2C initiative?
The intent of shared services is to provide excellent service to the campus community in a streamlined and efficient way. These metrics provide insight into the quality of service provided and whether or not the campus needs are being met with this new model.
Looking at your performance measures, what findings are most interesting or compelling to you?
We are focused on continual improvement of the service we deliver to campus. These are only a few of the metrics we are monitoring. There is always room for improvement and we are committed to making slight changes daily to serve the campus better. Across OIT there are many areas of focus to deliver a large portfolio of services. Improvements and advancement in infrastructure, application support, project and portfolio management, academic technology and strategic planning, and customer service delivery are all underway. We are striving to ensure that IT is a strategic partner throughout campus—providing both immediate triage and resolution of issues as well as supporting business and academic strategic goals.
Metric – PeopleSoft Customizations
Why were these particular performance metrics chosen to represent progress toward operational excellence in your area?
We chose PeopleSoft customizations primarily because it was a benchmark used within the ERP (Enterprise Resource Planning) System diagnostic OE2C project. Certain customizations (approximately 250) represent code or logic that has diverted from PeopleSoft’s delivered functionality, and must be managed through each upgrade. Business units and OIT are partnering to reduce this count of customizations. It is not a simple task! The business must rewrite processes and procedures, and OIT must examine the change to ensure no unintended side effects are seen.
How do these metrics support the work of your OE2C initiative?
These metrics provide a measure of changes to business process. They also provide an idea of the speed of change that can be absorbed by IT developers, business analysts, and power users who operate the PeopleSoft system on a daily basis. Change requests still come for a variety of reasons (audit, critical errors, etc) and must be addressed. It requires delicate management to focus between the reductions and operations.
Looking at your performance measures, what findings are most interesting or compelling to you?
We have found the customization data compelling because our exploration has resulted in identifying good customizations such as integrations with other applications. For example, an integration allows for a business application to get data from our master system (PeopleSoft). Identifying this measure helps focus on the right reductions.
What are your main areas of focus going forward?
The data for customizations was gathered for the ERP diagnostic, and will now be tracked within a database for easier and more consistent reporting.
We will upgrade the my.SMU (also called Campus Solutions) system to the 9.2 version, and plan to use the opportunity to examine the ~250 customizations we are targeting.
We have also redesigned how we will create integrations going forward. This process allows for non-developers to perform critical integration steps.
IT Operational Metrics Dashboard

- Based on calendar year.
- A significant drop in the number of survey responses after 2013 is attributable to the fact that OIT drastically reduced the amount of surveys it sent out, due to feedback from a focus group that was conducted by HR and OIT.
- The minor drop in overall ratings in 2015 coincides with the shared services organizational design initiative being set in place. Improved ratings can be seen on slide that shows 2016 ratings.
- Goal: To maintain a 90% or higher satisfaction rate.
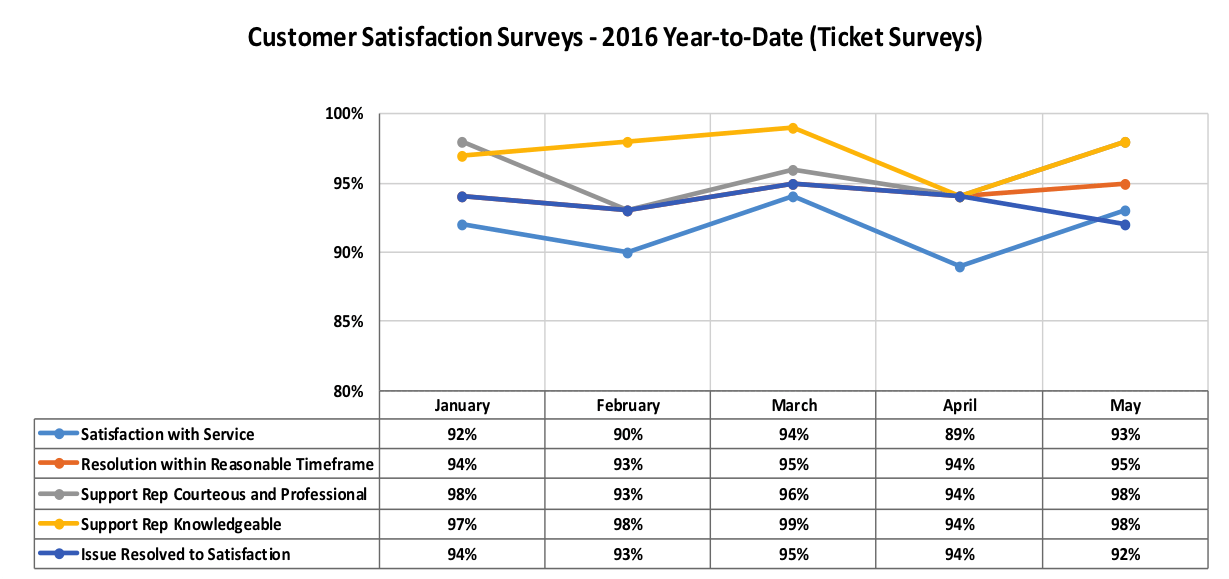
- Based on calendar year.
- The line for “Resolution within Reasonable Timeframe” is hidden because it follows the exact path (percentages) as “Issue Resolved to satisfaction”.
- Goal: To maintain a 90% or higher satisfaction rate.

Calendar Year
- This metric tracks the rate at which incoming calls are answered without rolling to voice mail.
- The increase in percentage from 2011 to 2012 is potentially attributable to the fact that the voice mail option was removed for incoming help desk calls. This led to calls either being answered or abandoned by caller.
- Goal: To maintain a rate of 95% or higher.
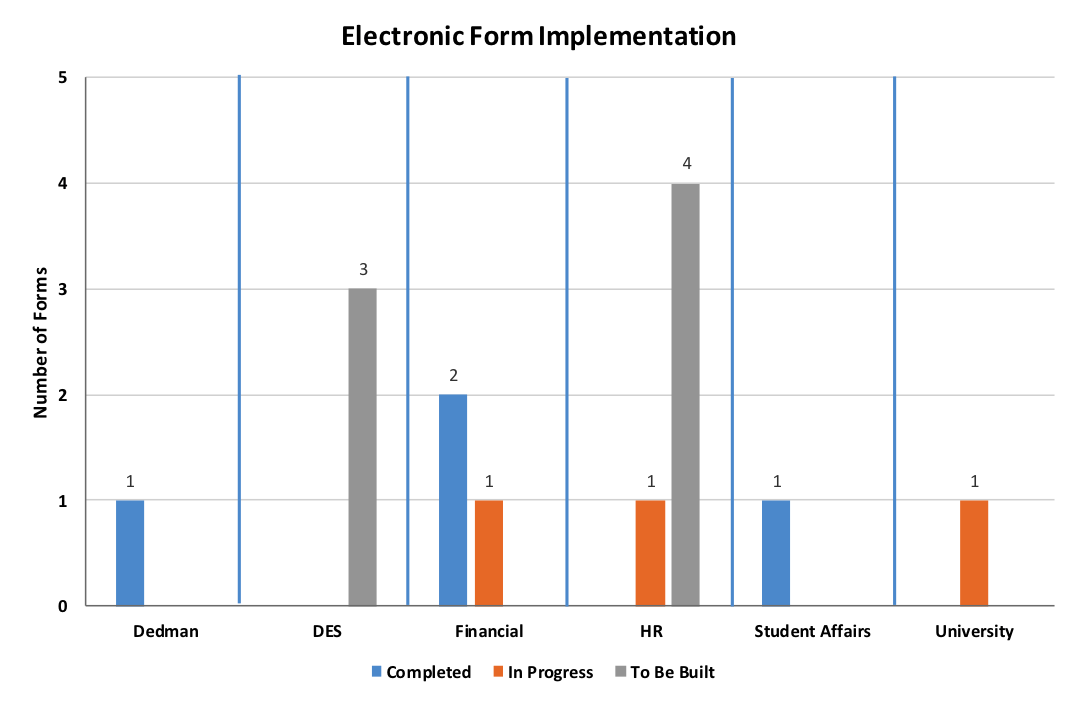
- *Division of Enrollment Services.
- **Comprised of campus departments that are not directly related to or supported by the University’s ERP systems.
- Goal: An increase of e-form implementations, which will create a more efficient workflow.
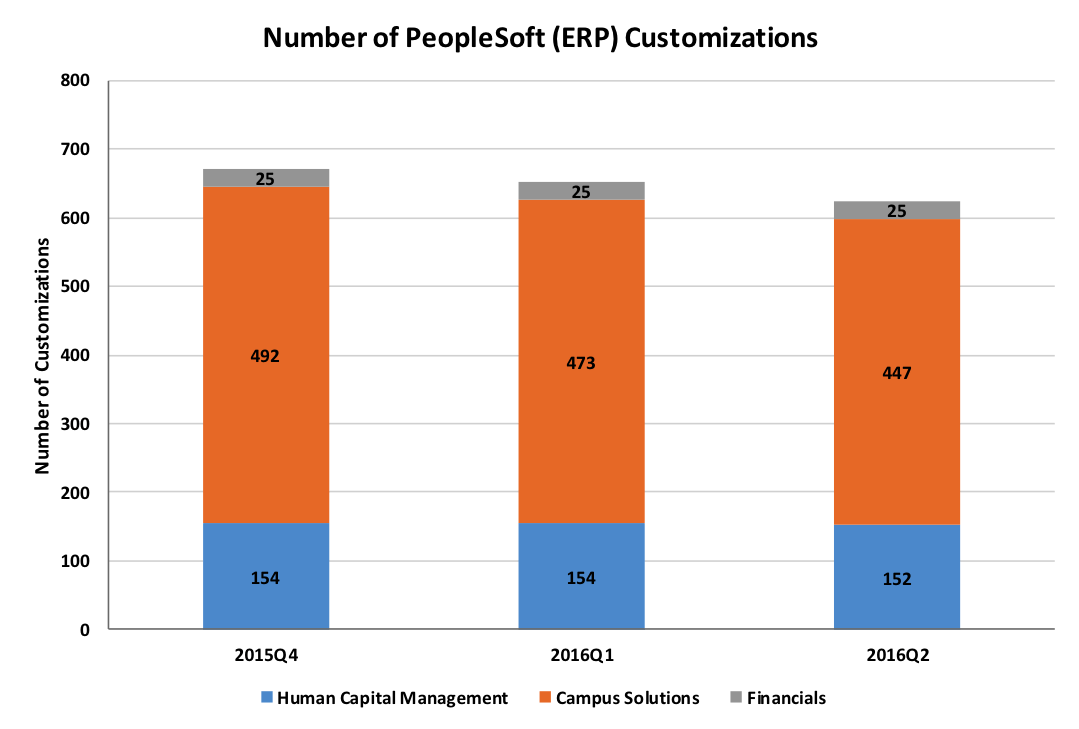
- Based on calendar year.
- Goal: To reduce the total number of customizations performed on the ERP system.
See more metrics in the coming weeks on our website or by subscribing to Operational Excellence’s email digest.