Stimulation Phase Completed at st1 Deep Heat Project

By Peter Malin, SMU Adjunct Faculty

Peter Malin, an Adjunct Faculty in the SMU Huffington Department of Earth Sciencesprovided this update on the st1 Deep Heat project in Espoo, Finland.  Peter’s company Advanced Seismic Instrumentation & Research (ASIR) is providing seismic monitoring for the project.

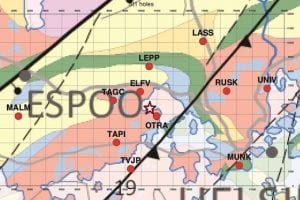
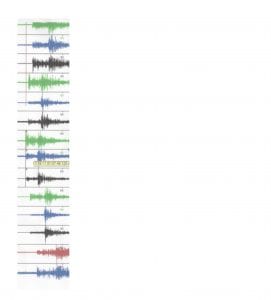
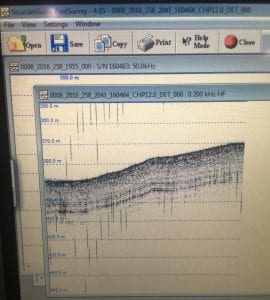
Stimulation of the OTN III well at the st1 Deep Heat project in Espoo, Finland has officially ended.  No Red-level alerts of  M>2.1 occurred during the 6 weeks of stimulation during which 18,000 cubic meters of water were injected at depths of 5+ km.  The well is now shut in while monitoring continues.  Below are some graphs of the seismic events recorded during stimulation, and a press release from st1.

Magnitude of seismic events versus time, along with stimulation injection pressure. Note that no events exceeded the Red threshold of M>2.1.
Earthquake locations relative to OTN III, shown as black to red line.

Press Release

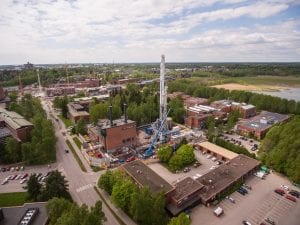
Geothermal Pilot Project makes progress in Otaniemi, Finland

Stimulation stage of St1’s geothermal project successfully completed

One of the most challenging aspects of St1’s geothermal project, the water-pressure opening (stimulation) of closed rock fractures, has now been completed at Otaniemi.  The stimulation was also used to investigate water flow in the deep rock by tracking the micro-vibration bursts it normally produces.  By pumping water into the existing 6.0 km-deep supply well in highly controlled cycles, these vibration bursts were kept within the limits predefined by Finnish environmental authorities. Analysis of the results, which will take 5–7 months, will be the next step and will determine how the project will continue.

The planned geothermal heat plant in Otaniemi could fulfil up to 10 percent of district heating demand with emission-free energy in the Espoo area.

 ”The stimulation test proved that water can be pumped into Finland’s tough granite bedrock and be made to flow through the rock. The controlled stimulation technology we opted for, and the pinpointing of the appropriate fracture zones, proved to work and the bedrock behaved as we had expected,” says Tero Saarno, Production Director at St1 Deep Heat.

A prerequisite for emission-free geothermal heat production is getting water to flow between two boreholes at a depth of several kilometres. Inducing micro-vibration bursts by water injection into the deep bedrock is thus an essential aspect of geothermal heat plant construction.   In fact, because of the unusual depth of the Otaniemi project, it is the only way to study the water flow needed for sustainable-heat production. It also allows for accurately determining the drilling path for a production borehole, which is needed to bring up the injected water.

Stimulation monitored by authorities – vibration bursts heard in neighboring areas

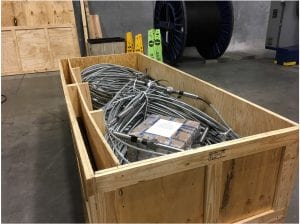
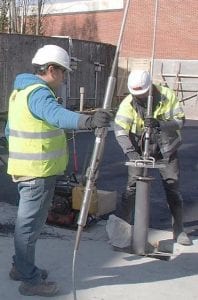
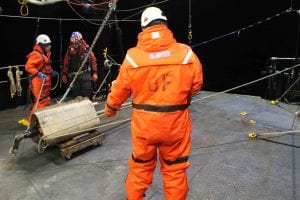
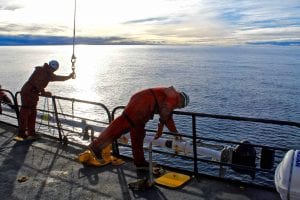
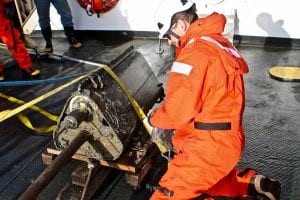
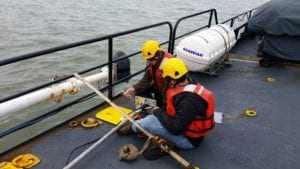
 During the stimulation stage, experts from St1 pumped water into the 6-km deep supply borehole, monitoring this process with underground geophones.  These sensors were installed in boreholes in the bedrock, allowing them to see the thousands of micro-vibration bursts associated with the stimulation. The size limit for the micro-vibration bursts were specified in advance by Finnish environmental authorities, in this case to a much lower level than are common, for example, in blasting operations. In addition, the Institute of Seismology at the University of Helsinki used its own geophones to independently monitor the stimulation. To stay within mandated limits, the stimulation was performed in a controlled manner, and thereby ended up posing no danger to people or damage to buildings and their contents.

“Because the site is located in the Helsinki metropolitan area near housing and infrastructure, the magnitudes were set so low that the disturbing effects would probably remain minor. On site, the effects of stimulation were closely monitored and reacted to quickly when needed,” says seismologist Tommi Vuorinen of the Institute of Seismology.

The highest micro-vibration burst measured by the underground geophones during the water simulation test was a magnitude of M1.9.   Ground motion sensors installed by an independent monitoring company showed this event did not lead to limit-exceeding movements in local building and critical facilities.

According to Tero Saarno, the only surprise during the stimulation phase was the noise nuisance caused by the more powerful micro-vibration bursts.  The transmission of these bursts through the rock was a new finding, recorded for the first time with instruments to study their mechanisms.  During the stimulation, they were audible as distant thunder and/or bangs, the largest causing thunder-like vibrations in certain areas.

“I hear for the first time such noises coming from such small micro-earthquakes, even though I have lived and worked most of my life in very active earthquake areas – including California, Hawaii, New Zealand and Turkey. It is exceptional that these sounds are even audible, as the sediment layers of the Earth normally absorb them. The unique measurements made by st1 opens up a whole new area of research, aimed at identifying their causes, and the potential effects of nearby bays and the uniqueness of Finnish bedrock, “says Peter E. Malin.  Malin is a member of the project expert team, an R&D Director at the seismic monitoring company ASIR, and a Professor of Seismology at the German Geoscience Research Center in Potsdam.

“Local residents have provided us with valuable observations on the resulting noise,” says Saarno. “Mid-way through the stimulation, we also began acoustic measurements in the Laajalahti region and in Munkkiniemi. Based on the observations we received, instruments were installed in places such as the basement and roof of a house in Munkkiniemi.   They were also installed in the clay layer of Pikku Huopalahti.

Internationally renowned Kalliotekniikka Consulting Engineers Oy were responsible for the ground-based sound and vibration measurement.  The measurements were made at locations based on local residents’ observations.  “These measurements showed the sound bursts and associated vibrations were not even close to the limits set for construction-blasting work,” explains Saarno.   “The measured vibration levels on the ground were really small: only 1/100 of the actual level that could cause damage to the buildings. Also, noise measurements were clearly below the guidelines of the Ministry of Social Affairs and Health throughout the project, “says Vesa Holmström, Technical Manager in Kalliotekniikka.

Saarno also noted that, when finished, the geothermal plant will not cause further audible micro-sound bursts or vibrations.

Best international expertise in use

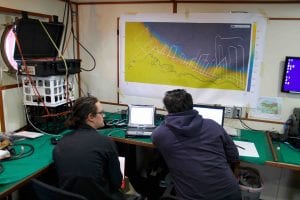
A team of 25 experts have been working in shifts around the clock during the stimulation phase at St1 Deep Heat’s Otaniemi construction site. The best international geothermal expertise and experience from previous projects was deployed.

“This is the first time that geothermal heat from these kinds of bedrock conditions has looked promising and economically viable. If successfully continued, the project represents a major opportunity for clean heat production and, significantly, further energy independence for Finland. It is rare for a private company to take this financial risk and begin solving the challenges posed by bedrock geothermal in a systematic and determined manner – it is a good example of modern Finnish sisu” says Director of Development Malin of ASIR. ” The Finnish pilot project is being followed with interest all around the world. If the project succeeds in Otaniemi, it will be duplicated elsewhere”.

The next step is the analysis of the micro-vibration burst measurements and the modelling of the heat reservoir response to cold water circulation. On this basis, a more precise idea will be formed of the direction in which to continue drilling an existing 3 km water-collection borehole to meet current 6 km water supply hole.

More information:

St1 Deep Heat Oy, Production Director Tero Saarno, +358 50 373 1923, tero.saarno@st1.fi

Project website www.st1.eu/geothermal-heat

 St1 Nordic Oy is a Nordic energy group whose vision is to be the leading producer and seller of CO2-aware energy. The Group researches and develops economically viable, environmentally sustainable energy solutions. St1 focuses on fuels marketing activities, oil refining and renewable energy solutions such as waste-based advanced ethanol fuels and industrial wind power. The Group has 1400 St1 and Shell branded retail stations in Finland, Sweden and Norway. Headquartered in Helsinki, St1 employs currently more than 750 people. www.st1.eu

Stimulation underway at st1 Deep Heat project

By Peter Malin, SMU Adjunct Faculty

Peter Malin, an Adjunct Faculty in the SMU Huffington Department of Earth Sciencesprovided this update on the st1 Deep Heat project in Espoo, Finland.  Peter’s company Advanced Seismic Instrumentation & Research (ASIR) is providing seismic monitoring for the project.

Stimulation of the 6.4 km OTN-III well at the st1 Deep Heat project in Espoo, Finland began on June 4, 2018 and continues to the present time.   There are 5 stages of packed-off, ball-operated hydraulic-stimulation equipment along the uncased bottom 750 m of the well.  About 10,000 cubic meters of drinking-quality water have been injected via 3 of the 5 stages, with pumping currently occurring on stage 4.  The engineering calculations provide a target volume of 18,000 cubic meters of water across the five stages for an economic return.

Diagram showing the 5 open hole stimulation stages at the bottom of the OTN-III well.

Near-real time seismic analysis has been provided by ASIR 24 hours a day 7 days a week during stimulation.  As required by the public safety Traffic Light System (TLS), the turnaround on M>1.2 events is 5 minutes.

As has been seen at other Enhanced Geothermal System projects, there has been a large amount of microearthquake activity during stimulation.  There have been about 15,000 events at magnitudes below M0.  The ASIR team has determined locations for about 5,000 events.  Most of these events fell within the green protocol in the TLS, i.e. <M1.2.  There have been ~17 events which triggered the amber level with 1.2<M<1.8.  These events resulted in a “Notify and Continue” response according to the TLS protocol.

By monitoring the seismic activity so closely, and by providing detailed location data so quickly, the teams are able to adjust stimulation pressures and flow-rates as stimulation occurs, thus avoiding (so far) any red events of >M2.1 which would result in “Stop and Notify, Resume Only if Permissible”  on the TLS protocol.

Stimulation is expected to continue for several more weeks.

Along with the 24/7 work at OTN-III there has been time for celebration as project manager Tero Saarno got married in early June.

Peter Malin, Peter Leary and Sergio Valenzuela of ASIR at Tero and Jenni Saarno’s wedding.


Drilling phase of st1 Deep Heat project completed, stimulation in a few days!

By Peter Malin, SMU Adjunct Faculty

Peter Malin, an Adjunct Faculty in the SMU Huffington Department of Earth Sciences provided this update on the st1 Deep Heat project in Espoo, Finland.  Peter’s company Advanced Seismic Instrumentation & Research (ASIR) is providing seismic monitoring for the project.

The drilling phase of the st1 Deep Heat project has ended with OTN-III drilled to a measured depth of 6.4 km by the end of April, 2018.    Following drilling, this well was logged, with wireline methods unable to get to TD, so a drill pipe system was brought on site.  Logging was complete today, 17 May, and placement of packers for the stimulation phase is to be determined by tomorrow.  Stimulation will be approached in a slow and carefully monitored fashion, beginning with low pressure and flow on the 1st stage of the 5 stage packer and sleeve system.

A monitoring network has been established to detect any micro-seismic activity associated with stimulation.  The monitoring network consists of 13 vibration monitoring stations called the Surface Network, all located in critical ground level facilities, and 12 borehole seismograph stations called the Satellite Network, located in 350 to 1200 m boreholes.  In addition, a ten-level vertical array of 3-C seismometers has been installed in the OTN-II borehole, between 2.2 and 2.7 km depth.

Monitoring stations around the st1 Deep Heat project in Espoo, Finland.

These monitoring stations are linked to a Traffic Light System (TLS) where protocols are in place to continuously monitor and respond to any seismic events.  Thresholds and responses have been established and are in place.

Traffic Light System for monitoring and responding to events at the st1 Deep Heat project.

Baseline monitoring prior to stimulation began in January 2018 (6 months of required reporting before licensing), with staged TLS Amber and Red alert exercises in April.  Monitoring will continue throughout stimulation, and beyond the end of the stimulation period.

Stimulation is scheduled to begin at the end of May 2018.  Stay tuned – you will be among the first to know how it all goes!

Rotary Drilling at st1 Deep Heat

By Peter Malin, SMU Adjunct Faculty

Peter Malin, an Adjunct Faculty in the SMU Huffington Department of Earth Sciences provided this update on the st1 Deep Heat project in Espoo, Finland.  Peter’s company Advanced Seismic Instrumentation & Research (ASIR) is providing seismic monitoring for the project.

In September 2017 drilling recommenced on the st1 Deep Heat Project in Finland.  Well OTN-III, which had been drilled to 4,500 m using air drilling, switched to water drilling.   Over the course of 60 meters, 3 drill bits were consumed.  The decision was made to switch to rotary drilling.  Rotary drilling commenced and a “J” incline to 35° began.

Aerial photo of st1 site with drilling rig in the center.

At 5,020 m, with an inclination of 20°, a fault zone was encountered.    The fault zone caused a 3 week delay in drilling as the drill bit became stuck several times.  After the drill bit was freed the first time a Jar device was attached to help release the bit on subsequent occasions.  During this process the well was cemented and re-drilled at least 6 times.

During one of the recovery efforts for the drill bit an earthquake occurred.  The ASIR team recorded the earthquake on their subsurface equipment with a magnitude of -0.8 to -1.

Map of the st1 site with seismic stations shown as dots. Star is the drill site.
Seismic event at st1 following a "Jarring", magnitude about -1. About 1 second of 3 component seismograms, vertical, east and north for the following stations: RUSK, LEPP, ELFV, TVJP, MUNK.
Seismic event at st1 following a “Jarring”, magnitude about -1.  About 1 second of 3 component seismograms, vertical, east and north for the following stations: RUSK, LEPP, ELFV, TVJP, MUNK.

After making it through the fault zone, rotary drilling continued.  The well is currently at 5,200 m with an inclination of 30°.

The next step is logging of the well from 3,500 m to 5,200 m followed by continued drilling at the 30° incline.  The goal is to drill to 6,200 m.  Stimulation at 6,200 m is scheduled for December 2017 or January 2018.

st1 Deep Heat Drilling to Resume

By Peter Malin, SMU Adjunct Faculty

Peter Malin, an Adjunct Faculty in the SMU Huffington Department of Earth Sciences provided this update on the st1 Deep Heat project in Espoo, Finland.  Peter’s company Advanced Seismic Instrumentation & Research (ASIR) is providing seismic monitoring for the project.

Following a hiatus, drilling is set to resume on the st1 Deep Heat project in Finland.  The well OTN-II has been drilled to a depth of 3325 m with air hammer.  OTN-III has been drilled to a depth of 4,500 m with air hammer.   The new seismic array has been purchased and a special borehole is being prepared for its installation.

ASIR seismic equipment ready for installation in Finland.

The deeper phase of drilling will begin on OTN-III where a water hammer will be used to drill from 4,500 m to 5,000 m.  The well will then be logged with a caliper and sonic.  From 5,000 m to 6,000 m the well will be deviated to ~45° using Tricone mud drilling.  The final phase of drilling on OTN-III will continue straight (with the 45°deviation) to the target depth of 7,000 m using water hammer.

Following drilling, OTN-III will undergo stimulation.  ASIR will be monitoring the stimulation using micro earthquakes (MEQ).  Stimulation is scheduled for September 2017.

ASIR working with a digital array.

st1 Deep Heat Project Update

By Peter Malin, SMU Adjunct Faculty

Peter Malin, an Adjunct Faculty in the SMU Huffington Department of Earth Sciences provided this update on the st1 Deep Heat project in Espoo, Finland.  Peter’s company Advanced Seismic Instrumentation & Research (ASIR) is providing seismic monitoring for the project.

Quick Background

St1 Deep Heat is a pilot project creating Finland’s first industrial-scale geothermal district heating plant.   Two wells are being drilled to approximately 7 km through granite.  Water injected into the first well will be heated by the bedrock, then pumped up the second well and fed through a heat exchanger in the district heating network.  The plant seeks to produce up to 40 MW of thermal energy.  Drilling of the two wells began in April 2016, and one well had reached 3.25 km by August 2016, the second 4.5 km by November 2016.

View of the drill rig for the st1 Deep Heat project in Espoo, Finland.

Current Status

At the moment there are 2 wells drilled with air hammer, OTN-II to 3.25 km and OTN-III to 4.5 km.  Both are in basement rocks from the very beginning.  Current OD is 12 3/8”.  Best day’s drilling using air to lift cuttings was ~240 + m in 24 hours, worst day(s) 0.  Drilling rates improved once a method for clearing the cuttings with air flow was established.  The drilling rig is now being switched over to water hammer and cutting lift.  The aim is to initially drill OTN-III vertical to 6 km, deviate by 45 degrees, and then stimulate the deviated section.

Dill bit used with the air hammer, st1, Espoo, Finland.

Roughly 3 major facture zones were encountered so far in both OTN-II and OTN-III.  One at about 875-900 m, then 2400 m and, so far, 2900 m.  Based on the geomechanical models, air drilling should have failed at 2.5 km, 2 km shallower than OTN-III.  There was one swarm of induced earthquakes due to casing cementing escaping upward out of the 2900 m fracture system.  The largest event was a zero, and all the events locate roughly at 2 km depth and within a few tens of meters of the drill hole.

OTN-II is then to follow based on the results of OtN-III effort – but likely to be drilled no matter the results.  A pressing question is: does OTN-II also need to be stimulated.

ASIR installed 10 borehole seismic stations by last April, including an array of 24 equally spaced 3-Cs in a 2 km core hole.  Following damage, this array is being replaced.

ASIR deploying instruments as part of the seismic monitoring array, st1, Espoo, Finland.

Schlumberger has be retained to do the low-flow stimulation of OTN-III, to take place end of March/beginning April 2017.

SMU Geophysicists Continue NETL-Sponsored Research Voyage

Thursday September 22, 2016

Northern lights. Polar bears. Sea ice. Oh, and a little bit of data too!

By Dr. Ben Phrampus, SMU Alum

It is now day 11 aboard the Norseman II and oh boy a lot has happened since our last update!  I will try to condense our epic adventure down so I can get back to data processing and interpretation.

Heat flow deployment with Ben Phrampus (far left) and Rob Harris (far right). Sometimes you just have to manhandle the probe to get it to cooperate!

We have been collecting heat flow and chirp data for the last 10 days along four transects across the Beaufort continental margin.  We have collected 116 heat flow measurements spanning over 500 km of the margin and ranging from ~200 m below sea level down to almost 2000 m.  Additionally, we collected over 200 km of chirp data imaging the shallow subsurface along our heat flow transects. All the while, we have been processing data, interpreting our results, and writing up our findings. I won’t spoil the surprise here, but let’s just say we see some very interesting processes occurring offshore Alaska!

During our time at sea we had multiple equipment deployments and recoveries. It takes a lot of teamwork (and some heavy machinery) to get the 4 m long heat flow probe over the side of the ship safely, especially when there are 5 ft swells and 20 mph winds.  We have an excellent crew of course and have recovered and deployed the probe 8 times with no problems. As the science crew, we get to dress up in our mustang suits and assist in the deployment. This is a great opportunity to learn about the safety procedures used on scientific vessels like the Norseman II and to learn the patience and discipline needed to work at sea. Even the students on their first cruise help in the deployment and engage in the equipment maintenance.

Madie in her mustang suit getting ready in our last heat flow probe recovery. Look how happy she is working in the frigid Arctic!

To process our heat flow data we use the temperature time series to establish an equilibrium temperature and determine the thermal gradient. We also use a calibrated heat pulse to determine the thermal conductivities of the sediments. Taken together we can calculate the heat flow in the marine sediments. While this does not sound particularly exciting, the information provided by this simple technique is extremely useful in understanding tectonics, fluid flow, gas hydrate dynamic, and even ocean temperature variations.

 An example heat flow measurement before processing. On top is the temperature time series. Below are the water temperature, tilt, and depth of the probe. All of this information is used to accurately determine the heat flow of the marine sediments.
An example heat flow measurement before processing. On top is the temperature time series. Below are the water temperature, tilt, and depth of the probe. All of this information is used to accurately determine the heat flow of the marine sediments.

While we have collected a lot of data, we have also had a lot of fun and seen some really interesting and rare sights!  At night, during the uncommon occasion that the clouds break we get to witness one of the most bizarre yet beautiful sights on this planet.  The northern lights are like nothing I have seen before. These strange lights twist and turn while changing colors from green to yellow and red.  They cross the sky both fading and shining is mesmerizing patterns. Sadly, it is extremely difficult to capture this beautiful performance on camera when you are riding a moving ship, but even if we could, you would still miss the twisting dance of the Aurora Borealis. All I can say is you need to witness them for yourself to really appreciate their enchanting movement.

Aurora Borealis in the Arctic sky. Credit to Madie Jones for her epic picture.

On one of our steaming trips between data collection sites, we ran into sea ice. I found this extremely interesting. I have been on multiple ships before this cruise, with one being in the Arctic Circle north of Norway, but I have still not seen sea ice till this cruise.  While relaxing in the living area on the ship, we learned we were in an ice field when the ship started to divert course from the typical straight-line path. We look out the window and see a large island of ice off the starboard side of the ship! Needless to say we all ran outside (with our safety gear on of course) and began taking pictures. You can see many different colors in the ice. You see the white of the typical ice pack, the brown of Arctic sediments, the green of the algae covered ice, and the deep blue of the multiyear ice.  The ice was really cool to see (pun intended), but what the ice actually brought really blew all of us away.

Beautiful sea ice on our journey to the last heat flow transect. We noticed the fog always follows the ice. Where you have one hazard, another seems to follow.
The ice can take on some really strange shapes as it is subjected to the harsh conditions of the Arctic.

Later that day, at the beginning of our last heat flow deployment we were in the middle of an ice field getting ready to deploy the heat flow probe when we saw something we all hoped for, but that none of us imaged we would see. Off the starboard side of the ship about 0.5 miles off swimming through the ice we noticed a polar bear!  But not just one polar bear, but a momma polar bear with her two cubs! They must have been curious about us because they started swimming in a straight line directly towards the ship.  The science crew was amazed, but the ship crew was even more surprised! They have all seen polar bears before, having worked in the Arctic for many years, but the bears typically avoid ships and they definitely do not swim towards the ship.  This momma bear was really curious though and swam towards us to within 30 yards of the ship with her cubs in tow. She and her cubs then stopped and were watching us just as intently as we were watching them. It was a strange moment while they were tying to understand us, we were just flabbergasted staring at them. Unfortunately, our time together was short as we had more science to do.  So we moved on to our next waypoint as not to disturb the happy family on their ice crossing adventure.

Momma bear and her train of cubs.
Polar bears swimming directly towards our ship! This was truly an incredible sight.

While the data collection is over, we still have a lot of science to do. From data interpretation to paper writing and publishing, it is still a long journey to the final scientific product.  Speaking of long journeys, we are currently steaming towards Nome, AK to disembark. With the addition of more ice and potentially rough weather, it appears we have a three-day journey back to port. But along the way we get to travel through the Bering Strait (maybe we can see Russia), get another opportunity to spot more rare Arctic creatures (Walrus? Narwhal? Santa Clause?), and to potentially see the Aurora one more time (please just one more time!).

More updates to come as we finish our epic Beaufort adventure!

SMU Scientists Collecting Heat Flow and Chirp Data

Sunday, September 18, 2016

Halfway Point and Northern Lights!

By Madie Jones (Master’s student, SMU)

Well, we’re officially past our halfway point as it is day 7 aboard the Norseman II. Only three full science days left until we head back to Alaska to end our time at sea. We’ve been working around the clock to collect heat flow and chirp data along 3 transects, labeled in red on the map below. The yellow lines on the map are the track lines of airgun seismic data collected by the USGS in 1977. We’re using some of the USGS seismic lines to help make sense of what we see in the heat flow data.

Here is a map of our study area in the Beaufort Sea. The yellow lines show the track of the 1977 USGS seismic survey. The red lines show the sites where we are collecting heat flow data on this trip.

We started on the transect farthest to the East (BHF 1, 2, 3), and worked our way West to BHF 4 and BHF 5 (BHF stands for Beaufort Heat Flow). The first line took the longest, but once the crew and scientists started to get into a routine, we worked very efficiently through the last two lines. So far we’ve collected 60 heat flow data points and 100 km of chirp seismic data!

We’ve been working literally around the clock. Dr. Hornbach and Dr. Harris are on 12-hour rotations. Casey, Ben and I are set to work 8-hour rotations. That way there is always at least 1 chief scientist and 1 graduate student or postdoc working every hour of the day. That also means heat flow probe deployments and recoveries can happen in the middle of the night when it’s pitch black outside and you can’t see past 5 feet from the boat.

Here’s Dr. Harris and 2 of the ship’s crew getting ready to deploy the heat flow probe at 5:30am! It looked like they’re deploying a heat flow probe into black abyss.
Here’s Dr. Harris and 2 of the ship’s crew getting ready to deploy the heat flow probe at 5:30 am! It looked like they’re deploying a heat flow probe into black abyss.

Dr. Hornbach, Dr. Harris and Dr. Phrampus are starting to make some really interesting interpretations of the patterns they’re seeing in the heat flow data. I’m pretty new to the world of gas methane hydrates and heat flow but I’ve learned so much listening to them brainstorm and talk about what could be happening in the subsurface to explain what is seen in the data. This is the first heat flow study of the Beaufort Sea, so the data we’re collecting has not existed before now.

Crew securing the boom to the port side of the ship. The chirp is the tiny black box on the very end of the boom. When the boom is lowered the chirp is about 15 feet underwater. When the chirp is transmitting we can hear it from the science lab inside the boat, it sounds like a dolphin chirping and swimming right along with us.

Today a storm rolled in, creating 14-foot swells and nearly 40 mph winds. Our 115-foot ship is currently heaved-to in a bay until the storm passes over. To give you some perspective, it becomes very difficult to walk around the ship, much less deploy the heat flow probe, with 5’ swells. I can’t even process what it would be like trying to stand up or walk around the boat or deploy a heat flow probe in 14’ swells.

We’re scheduled to get back out tonight after the storm passes for at least one more transect before our time at sea runs out. In the meantime, the scientists have started analyzing data, making maps, creating figures and getting a head start on writing Arctic heat flow papers.

Even with everything in full swing aboard the Norseman II, I’ve managed to find some time to take some pictures of the scenery out here.

Rainbow seen from the deck of the Norseman II.
This was the sunset from tonight, taken from the deck looking towards the bridge on the port side (trying to throw in as much of this new boat lingo as I can). This is one of my favorite pictures I’ve taken so far.

And…. tonight I got to cross an item off my bucket list. My 8-hour shift starts at 8pm and ends at 4am. So I’ve been up and working through the night, every night for the last week. Tonight around 3:30am, the science lab got a call from the ship’s first mate, Wayne, to let us know the northern lights were out and pretty strong. We hustled up to the bridge to watch the show. Words really can’t describe but for about 30 minutes we watched the green and red and white lights streak across the sky. I tried to take a picture with my phone, but as you could imagine the picture doesn’t even come close to doing it justice. While we were up in the bridge with Wayne he told us that the lights only come out like this once every couple of months.

Northern Lights from the deck of the Norseman II, Beaufort Sea.

I’m looking forward to getting back out to sea tonight to continue collecting heat flow data. I’ve already learned so much from the other scientists and I’ll be taking many things away from this experience. I’m feeling very lucky tonight to get to be a part of this cruise.  More updates to come!

You can see where the Norseman II is by clicking here.


SMU Researchers Collecting Heat Flow Data in Beaufort Sea

Wednesday, September 14

Hello from somewhere in the Beaufort Sea!

By Madie Jones (Master’s student, SMU)

It’s our 4th day aboard the Norseman II and data collection has been going smoothly. The ship’s crew is knowledgeable, friendly and helpful – if we need something done they seem to know exactly how to do it. The scientists have adjusted to our work shifts and sleeping schedules, and we are starting to get into a routine with data logging and monitoring the equipment. And I should also mention, the food on this ship is fantastic (shoutout to the cooks: Marlin and Daron).

So here we are! Out in the Arctic collecting heat flow and chirp data. Are you wondering what we’re doing this for and how it all works? I’ll try to explain.

Rob Harris and the ships Bowson, Jim, deploying the heat flow probe at our very first site. Any time we're out on the deck working we have to have on these big orange mustang suits to keep us warm in the freezing temperatures when very cold water is often splashing up onto the deck.
Rob Harris and the ships Bowson, Jim, deploying the heat flow probe at our very first site. Any time we’re out on the deck working we have to have on these big orange mustang suits to keep us warm in the freezing temperatures when very cold water is often splashing up onto the deck.

The Norseman II is currently steaming along a North-South transect across the North Slope of Alaska as we plunge the heat flow probe 3 meters down into the ocean-bottom sediments at a ~1 kilometer spacing. One deployment takes about one hour, because once the heat flow probe has landed in the sediments, you wait about 15 minutes for the probe to take measurements, plus the extra time spent ensuring the probe is oriented the right way before you drop it down. This operation is mainly done via cable on the ship’s winch, and it also takes a fair amount of time to reel out and reel in cable to raise and lower the probe. Our first transect has 34 heat flow probe deployment sites, and we are almost done with this first line with only 4 deployments left to go. Then, we will move on to another transect further to the West and do it all over again. The depth of the seafloor along our transects is about 1500 m starting on the deep side of the slope, and comes up to about 200 m just across the edge of the continental shelf. By the time we finish up here in the Arctic we will have completed several hundred heat flow deployments along 5-7 transects between Prudhoe Bay and Wainwright, Alaska.

Ben Phrampus and Matt Hornbach on the deck in mustang suits before pulling the heat flow probe back onto the boat.
Crew and scientists getting the heat flow probe secured on deck between deployments.

The heat flow probe data tells us about temperature, conductivity, how heat flows through the ocean bottom sediments, and can provide us with sediment samples. This data allows us to better understand how the Arctic Ocean formed, because oceanic crust cools as it moves away from the crust-forming margin. It also gives us information about gas methane hydrates, which can destabilize at depths of 200-300 m due to ocean temperature warming and this can cause slope failure events and tsunamis.

Matt Hornbach taking a mud sample for conductivity measurements.

In between each heat flow deployment site, we collect chirp seismic data to profile the top 10-20 m of ocean bottom sediments. This has been my favorite part! I think it’s the coolest thing ever when you can see stratigraphy way down below the surface of the Earth. In the chirp data we are looking for any signs of deformation, slope failure, fluid flow, faults, and other features of interest that might produce anomalies in the heat flow data.

A chirp profile taken at about 400 m ocean depth. You can see some really well defined stratigraphy in the top 20 m of sediment!

We also use the chirp in “Pinger Mode”, or listening mode. As the heat flow probe travels through the water column it lets out different pings that tell us about the orientation of the probe and state of the thermistors, and in listening mode we are able to keep track of the heat flow probe as it stays deep underwater for hours at a time.

Ben Phrampus and Rob Harris watching the chirp in Pinger Mode and keeping track of the heat flow probe during one of the deployments. That bathymetry map above them on the wall shows several white lines up and down the North Slope - these are some of the transects we're going to be collecting heat flow data along.
Ben Phrampus and Rob Harris watching the chirp in Pinger Mode and keeping track of the heat flow probe during one of the deployments. That bathymetry map above them on the wall shows several white lines up and down the North Slope – these are some of the transects we’re going to be collecting heat flow data along.

So far everything has been running smoothly, of course with the occasional kink but nothing crucial. For example, we lost the signal from the pinger on the heat flow probe last night so we had to bring it back aboard the ship to switch out the batteries. It turned out to be a minor inconvenience but you can probably imagine that we were trying not to freak out as we started to wonder: “Did we just lose the probe in the Arctic Ocean??”

The data are looking really good and I think everyone on board would agree that it’s a privilege to be out here studying a part of the world where very few people ever get to go. We’re collecting data that will be used for a long time by many scientists in the future, so everyone has been extremely involved, working together and coming up with quick solutions to the unavoidable setbacks that are a normal part of a project like this. Our 10 science days (+2 steam days) on the boat will be up before we know it (HOW has it already been 4 days!?!?) so we are working every hour to make sure we are collecting as much quality data as physically possible. I’m enjoying life at sea more than I thought I would…considering dropping out of grad school to become a pirate.

More updates to come!

SMU Geothermal Lab Researchers Aboard the Norseman II

Sunday, September 11, 2016

Aboard the Norseman II – Finally!

By Madie Jones (Master’s student, SMU)

Today is our 6th day in Alaska and I can happily say that we have FINALLY made it safely onto the Norseman II. After the weather in Wainwright failed to clear up enough for a flight out of Anchorage….three days in a row…we decided to change up the plans a bit and board out of Prudhoe Bay instead.  Friday and Saturday morning started off with disappointing weather updates from Wainwright: low visibility caused by fog and seas too rough for a crew change.

Dr. Ben Phrampus and Madie Jones at the top of Wolverine Peak with ice-capped Chugach Range in the background.
Dr. Ben Phrampus and Madie Jones at the top of Wolverine Peak with ice-capped
Chugach Range in the background.

We got to know Anchorage pretty well by our 5th day, eating out at restaurants for pretty much every meal and exploring downtown with the truck that our travel coordinators let us borrow.  Side note, if anyone ever visits Anchorage let me know and I’ll give ya some great food recommendations.  On Saturday, Matt, Ben and I decided to go on another hike.  We chose an 8.7 mile hike down and back to Wolverine Peak at an elevation of about 4200 ft.  It took us 5 hours, but the views from the top were incredible and definitely worth the struggle it took to get up there.

Dr. Matt Hornbach at the top of Wolverine Peak with Cook Inlet and the Alaska Range in background.
Dr. Matt Hornbach at the top of Wolverine Peak with Cook Inlet and the Alaska Range in
background.

This morning we woke up bright and early to fly to Deadhorse in Prudhoe Bay. Once we landed we were driven to the port to get water-taxied out to the Norseman II, which was about 3 miles offshore.  The drive through Deadhorse was eerie – this is such a remote, strange part of the world.  I’ll explain Deadhorse by quoting our driver, Roger, who said: “The best way to describe Deadhorse is by what it isn’t.  No one gets their mail here, there are no kids, no pets, no streetlights.  It’s not a city, it’s just a place.”  We drove by camps built for oil and gas workers who live here on and off for 2 weeks at a time.  Pipelines and huge abandoned rigs cover ground for as far as the eye can see.

The science crew wearing Mustang suits getting onto the water taxi.

The boat ride out to our ship and the boat transfer/crew change went down without a hitch and now we’re here working on the Norseman II for the next 10 days!  We spent the rest of the day setting up the heat flow probe and chirp equipment, meeting the crew and getting adjusted to life at sea.  Now that most of the equipment appears to be ready to go, we have a 12-hour steam to our first data collection site.  Here are some pictures of us getting equipment set up, which took all day and a lot of patience on everyone’s part.  But it’s also really fun and exciting because we’re finally doing the cool part!  This is, after all, the whole reason we’re here.

Madie Jones and Casey Brokaw mounting the chirp transducer so that it can attach to the boom on the side of the ship.
Dr. Ben Phrampus, Casey Brokaw, and Dr. Rob Harris getting the heat flow probe ready to go.

So that’s it!  We’re off to a great start aboard the Norseman II and we’re all looking forward to our first heat flow probe deployment in 12 hours.  You can follow our voyage on the Norseman II by clicking here.  More updates to come, but for now we’re all going to rest up for a big day of data collection and new challenges.