
The Garland Road Corridor.
Over the past several decades East Dallas has undergone many economic and demographic changes. The area began as an escape for white families during desegregation, but due to refuge resettlement has become a melting pot of cultures and religions. Its interesting history can be explained by three major points: desegregation, suburbanization, and refugee resettlement.
Desegregation

Spooky old Big Tex in the 50’s and another bad memory: Ku Klux Klan day at the State Fair of Texas in the 1930s.
Desegregation of the school systems in the United States was spurred by the Supreme Court case Brown vs. Board of Education in 1954 [1]. This case caused uproar throughout the country backed by many individuals’ racist ideals, specifically in the South. Dallas was no different. In a city-wide-election, citizens of Dallas voted four to one against school integration. In 1955 United States District Court Judge William H. Atwell ruled against desegregation in Dallas schools, claiming that the Supreme Court had overstepped their authority in the Brown case. Again in 1957 he refused two black children the right to attend a white school although it was closer to their home. “Until 1961, Dallas was the largest city in the South with a segregated school system” [2]. However in 1961 the Dallas School Board implemented a desegregation plan and on September the sixth eighteen black children started first grade in what had been up until then an all white elementary school. Although there was extreme dissatisfaction with the treatment of black children in these “desegregated” schools, Dallas was declared completely desegregated in September 1967.

Oak Lawn in the early 50s.
While desegregation was legally put into effect in Dallas most white people in the city did not agree with it. Many people believed that without segregation their children would be exposed to negative ideas and experiences because of the black children now present at school. This dissatisfaction with the education system caused many white families to leave the inner city of Dallas and move to many of the surrounding suburban areas, one being East Dallas.
[1] http://www.civilrights.org/resources/civilrights101/desegregation.html
[2] http://library.law.smu.edu/Collections/DISD/Background-Info
Suburbanization
The Garland Road Corridor began as a center for suburban development in Dallas in 1924 with the development of Forest Hills neighborhood. As time passed, the area would be marked with further neighborhoods— such as Casa Linda Estates, Lochwood Estates, and Little Forest Hills. So why did development begin, and who arrived?
According to the 1960 US Census, less than one percent of the area’s population was non-white. In this way, the culture of the 75218 zip code today seems to be the product of the social phenomena known as “white flight” into suburbia. Robert M. Fogelson, a professor of urban studies and history at the Massachusetts Institute of Technology, attributes the mass migration of white Americans from the center of the city to the periphery to “fears of disease, crime, immorality, poverty, immigration, and public disorder.” To keep such issues as these and unwanted change at bay, developments imposed restrictive covenants on home buyers and leasers, such as contractual agreements to only sell to a certain demographic, or for the builder to build only in a certain architectural style, as well as minimum price requirements. All of this kept the area from diversifying, but that trend is changing.
According to the 2012 census, tracts number 82 and 129 have minority population of 28 and 15 percent, respectively. The majority of these groups are either African American or Hispanic, and the median income remains above average in both areas at $40,630 and $47,250. Based on these characteristics, the area remains relatively wealthy, but has adapted to allow for cultural diversity.
Refugee Resettlement
The diverse setting of Garland Road is caused partly by the refugees that moved in during the 1970s, and these refugees come from all over the world. For example, “in 1979 [the Dallas-Fort Worth area] became home to an estimated 1,000 Hmong in 200 families.”[1] Around 1980, many Vietnamese immigrants moved to Dallas, and the population of Vietnamese people was 231,000 in 1980.[2] Programs like the “Catholic Charities of Dallas (CCD) began resettling refugees” in the 1970s.[3] Impressively, Dallas relocated 25,867 refugees from 1983 to 2004.[4] And today, “it is home to refugees from numerous countries, including Iraq, Myanmar, Bhutan, Burundi, Somalia, Ethiopia, Democratic Republic of Congo, Eritrea, and Mauritania.”[5] Immigrants had reason to stay in Dallas because they were able to find jobs in the city. For example, Ethiopian immigrants enjoyed a high employment rate at 92, which let them stay in Dallas rather than migrate elsewhere.[6]
[1] http://www.migrationpolicy.org/article/belonging-resettlement-experiences-hmong-refugees-texas-and-germany
[2] http://www.dallasnews.com/news/metro/20150808-one-familys-journey-from-vietnam-changed-lives-of-many.ece
[3] https://www.catholiccharitiesdallas.org/programs/res/
[4] http://www.migrationpolicy.org/article/refugee-resettlement-metropolitan-america
[5] http://www.rsc.ox.ac.uk/news/the-hip-team-in-dallas
[6] http://www.everyculture.com/multi/Du-Ha/Ethiopian-Americans.html
Ethnicity


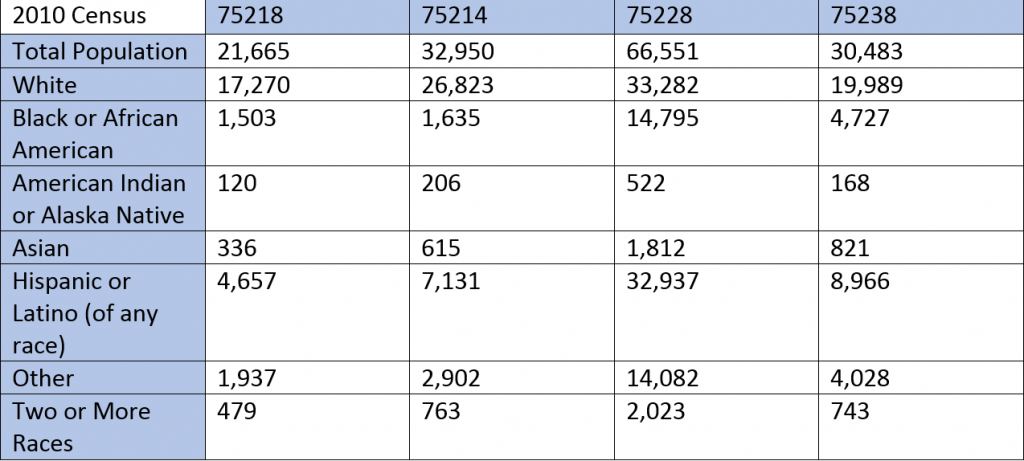
Between the years 2000 and 2010, the total population in the four areas of interest showed relatively little change in comparison to that exhibited in the breakdown of race in each zip code. Specifically, the Hispanic population showed the most dramatic growth of all ethnicities included. This growth was exhibited most prominently in the 75228 area code, where the population increased by fifty-six percent. The White population decreased in all zip codes, while the Black or African American population demonstrated a decline in only two zip codes, 75228 and 75238. Additionally, the Asian population exhibited growth during this time in all areas except the 75228 zip code. In particular, this group almost doubled its population in the 75238 area, increasing from 453 to 821 individuals.
Average Home Price


In all zip codes, the median value of a home increased by at least six percent between 2011 and 2015. In the 75214 area, this growth was the largest as the median value of a home increased by sixteen percent. Likewise, the median cost of rent also increased consistently between 2011 and 2015 with the exception of the 75218 area, where there was a two percent decrease in the cost of rent during this time.
Income

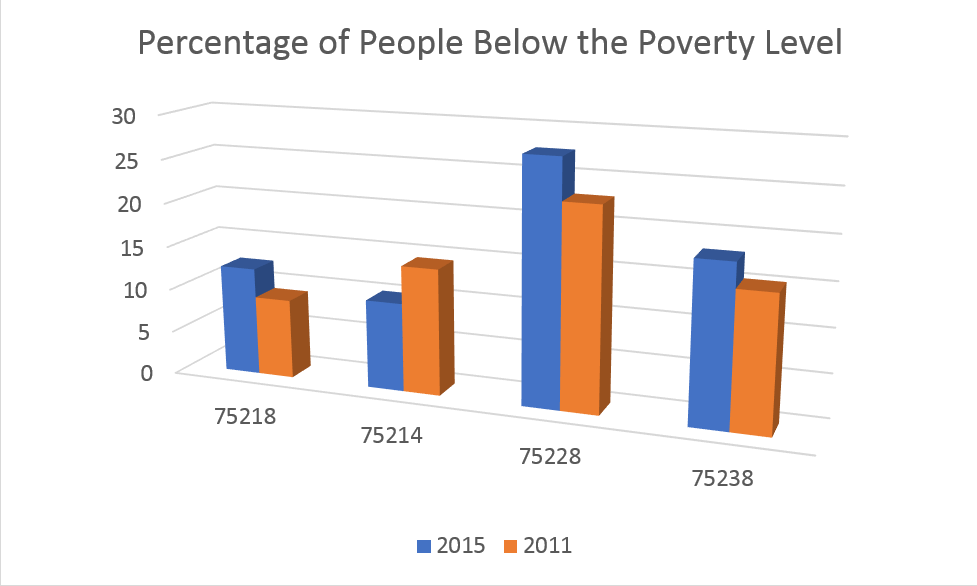
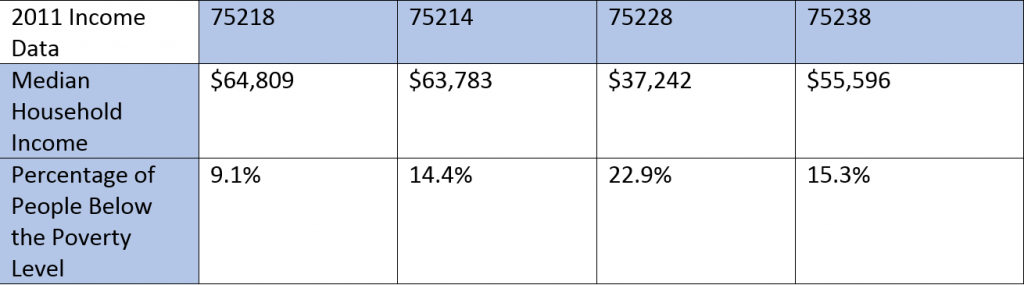

Between 2011 and 2015, the median household income increased in both the 75218 and 75214 zip codes. However, this value decreased over the same time frame in the 75228 and 75238 areas. Additionally, the percentage of individuals living under the poverty level increased in every area except the 75214 zip code, where this value decreased by 4.3%. Interestingly, the 75214 area also saw the greatest growth in median household income with an increase of nineteen percent from 2011 to 2015.